|
Download Data (XLS File) |
|
||||||||
|
||||||||
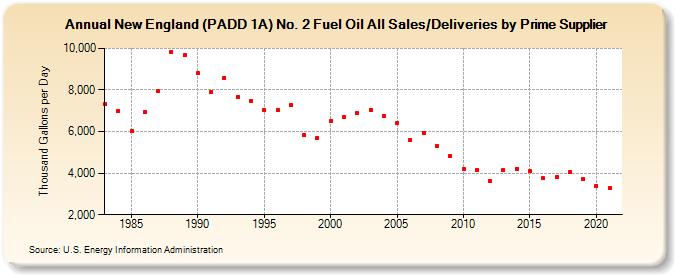
| New England (PADD 1A) No. 2 Fuel Oil All Sales/Deliveries by Prime Supplier (Thousand Gallons per Day) | ||||||||
| Decade | Year-0 | Year-1 | Year-2 | Year-3 | Year-4 | Year-5 | Year-6 | Year-7 | Year-8 | Year-9 |
|---|---|---|---|---|---|---|---|---|---|---|
| 1980's | 7,310.5 | 6,983.6 | 6,048.6 | 6,943.9 | 7,947.4 | 9,829.9 | 9,665.1 | |||
| 1990's | 8,798.9 | 7,905.3 | 8,595.8 | 7,684.3 | 7,488.8 | 7,034.7 | 7,031.4 | 7,265.9 | 5,844.1 | 5,709.6 |
| 2000's | 6,484.1 | 6,676.3 | 6,873.1 | 7,045.3 | 6,756.8 | 6,404.9 | 5,588.5 | 5,940.1 | 5,301.7 | 4,815.8 |
| 2010's | 4,187.0 | 4,161.9 | 3,614.8 | 4,152.4 | 4,215.3 | 4,099.7 | 3,745.2 | 3,793.8 | 4,042.8 | 3,715.7 |
| 2020's | 3,394.7 |
| - = No Data Reported; -- = Not Applicable; NA = Not Available; W = Withheld to avoid disclosure of individual company data. |
| Release Date: 6/1/2022 |
| Next Release Date: TBD |