|
Download Data (XLS File) |
|
||||||||
|
||||||||
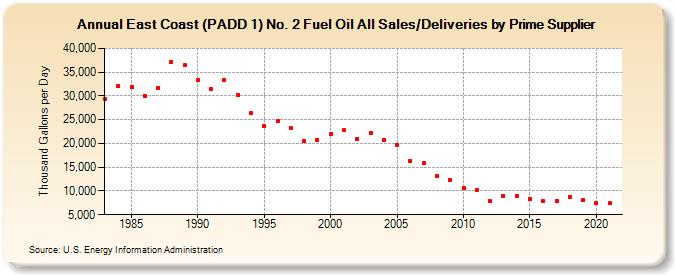
| East Coast (PADD 1) No. 2 Fuel Oil All Sales/Deliveries by Prime Supplier (Thousand Gallons per Day) | ||||||||
| Decade | Year-0 | Year-1 | Year-2 | Year-3 | Year-4 | Year-5 | Year-6 | Year-7 | Year-8 | Year-9 |
|---|---|---|---|---|---|---|---|---|---|---|
| 1980's | 29,397.8 | 32,128.2 | 31,795.1 | 29,989.8 | 31,707.5 | 37,162.2 | 36,431.6 | |||
| 1990's | 33,328.6 | 31,466.1 | 33,427.8 | 30,252.6 | 26,331.8 | 23,711.6 | 24,664.2 | 23,170.8 | 20,442.3 | 20,643.9 |
| 2000's | 21,948.8 | 22,809.8 | 21,017.1 | 22,200.8 | 20,789.1 | 19,768.0 | 16,318.2 | 15,787.4 | 13,050.7 | 12,210.8 |
| 2010's | 10,535.4 | 10,098.6 | 7,923.3 | 8,886.6 | 8,858.4 | 8,321.9 | 7,869.5 | 7,970.6 | 8,706.5 | 7,993.9 |
| 2020's | 7,379.4 |
| - = No Data Reported; -- = Not Applicable; NA = Not Available; W = Withheld to avoid disclosure of individual company data. |
| Release Date: 6/1/2022 |
| Next Release Date: TBD |