|
Download Data (XLS File) |
|
||||||||
|
||||||||
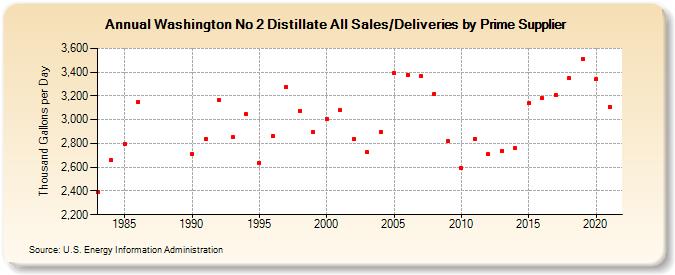
| Washington No 2 Distillate All Sales/Deliveries by Prime Supplier (Thousand Gallons per Day) | ||||||||
| Decade | Year-0 | Year-1 | Year-2 | Year-3 | Year-4 | Year-5 | Year-6 | Year-7 | Year-8 | Year-9 |
|---|---|---|---|---|---|---|---|---|---|---|
| 1980's | 2,387.1 | 2,659.7 | 2,795.1 | 3,148.8 | W | W | W | |||
| 1990's | 2,713.4 | 2,838.1 | 3,169.6 | 2,850.3 | 3,044.6 | 2,635.6 | 2,861.9 | 3,273.5 | 3,075.1 | 2,892.6 |
| 2000's | 3,007.4 | 3,078.2 | 2,839.2 | 2,724.6 | 2,899.3 | 3,392.5 | 3,377.0 | 3,364.1 | 3,219.1 | 2,818.7 |
| 2010's | 2,589.1 | 2,839.8 | 2,709.8 | 2,740.2 | 2,758.5 | 3,137.5 | 3,181.8 | 3,204.1 | 3,347.0 | 3,514.4 |
| 2020's | 3,339.4 |
| - = No Data Reported; -- = Not Applicable; NA = Not Available; W = Withheld to avoid disclosure of individual company data. |
| Release Date: 6/1/2022 |
| Next Release Date: TBD |