|
Download Data (XLS File) |
|
||||||||
|
||||||||
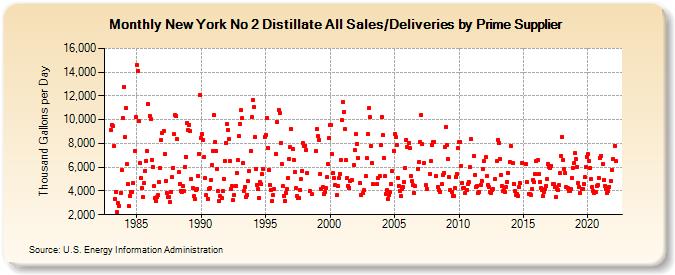
| New York No 2 Distillate All Sales/Deliveries by Prime Supplier (Thousand Gallons per Day) | ||||||||
| Year | Jan | Feb | Mar | Apr | May | Jun | Jul | Aug | Sep | Oct | Nov | Dec |
|---|---|---|---|---|---|---|---|---|---|---|---|---|
| 1983 | 9,127.7 | 9,570.9 | 9,445.4 | 7,761.1 | 3,347.1 | 3,900.1 | 2,204.8 | 2,954.8 | 2,766.6 | 3,860.4 | 5,746.5 | 10,131.8 |
| 1984 | 12,783.0 | 8,527.4 | 10,984.8 | 6,261.3 | 4,556.4 | 2,709.3 | 3,580.7 | 3,930.7 | 3,939.0 | 4,693.1 | 7,363.5 | 10,214.3 |
| 1985 | 14,638.1 | 14,096.3 | 9,851.7 | 6,377.7 | 5,107.8 | 4,225.1 | 3,478.1 | 4,644.6 | 5,698.7 | 6,559.1 | 7,341.3 | 11,338.5 |
| 1986 | 10,290.7 | 10,026.4 | 6,631.5 | 6,046.6 | 4,376.1 | 3,406.3 | 3,112.5 | 3,503.7 | 3,643.3 | 4,795.6 | 5,903.7 | 8,272.1 |
| 1987 | 8,841.3 | 9,065.1 | 7,116.0 | 4,838.6 | 3,812.2 | 3,489.2 | 3,496.2 | 3,076.7 | 3,951.0 | 5,146.3 | 5,956.4 | 8,769.9 |
| 1988 | 10,399.9 | 10,270.9 | 8,340.2 | 5,593.2 | 4,611.7 | 4,025.6 | 3,874.5 | 4,402.7 | 3,966.2 | 6,040.8 | 6,893.4 | 9,714.5 |
| 1989 | 9,137.2 | 9,564.2 | 9,015.4 | 4,991.3 | 4,269.5 | 3,534.7 | 3,300.4 | 4,084.0 | 4,175.1 | 5,280.1 | 7,138.6 | 12,064.2 |
| 1990 | 8,418.7 | 8,783.6 | 8,306.0 | 6,848.2 | 5,055.0 | 3,619.0 | 3,324.2 | 4,193.5 | 4,223.7 | 4,894.3 | 6,186.4 | 7,386.2 |
| 1991 | 10,353.2 | 8,128.5 | 7,343.0 | 5,867.9 | 3,957.3 | 3,131.9 | 3,533.7 | 3,380.3 | 3,989.4 | 5,025.5 | 6,547.8 | 8,068.7 |
| 1992 | 9,633.2 | 9,111.7 | 8,384.1 | 6,526.5 | 4,187.0 | 4,391.1 | 3,209.7 | 3,645.6 | 4,441.9 | 5,530.9 | 6,567.4 | 8,622.8 |
| 1993 | 9,639.0 | 10,772.1 | 10,106.0 | 6,337.1 | 4,032.8 | 4,335.1 | 3,528.2 | 3,661.2 | 4,809.5 | 5,660.7 | 7,401.9 | 10,198.3 |
| 1994 | 11,643.0 | 11,074.0 | 8,552.6 | 5,879.4 | 4,533.2 | 4,131.1 | 3,413.6 | 4,773.9 | 4,561.5 | 5,422.7 | 5,872.4 | 8,535.4 |
| 1995 | 8,703.0 | 10,174.9 | 7,654.9 | 5,788.9 | 4,519.5 | 4,102.1 | 3,159.9 | 3,676.1 | 4,163.2 | W | 7,132.8 | 9,766.4 |
| 1996 | 10,822.3 | 10,566.3 | 8,044.7 | 6,279.0 | 4,389.8 | 3,608.3 | 3,129.8 | 3,855.6 | 4,145.1 | 5,109.9 | 6,728.6 | 7,674.2 |
| 1997 | 9,176.0 | 7,529.7 | 6,630.3 | 5,561.7 | 4,219.5 | 3,567.5 | 3,388.2 | 3,442.6 | 4,120.1 | 4,969.1 | 5,705.5 | 8,022.6 |
| 1998 | 7,770.0 | 7,825.0 | 7,489.1 | 5,493.8 | W | 3,962.0 | W | 3,742.8 | W | W | W | 7,378.5 |
| 1999 | 9,191.3 | 8,598.8 | 8,295.5 | 5,462.7 | 4,186.3 | 4,323.1 | 3,745.6 | 3,904.9 | 4,217.2 | 5,139.5 | 6,266.7 | 8,456.4 |
| 2000 | 9,554.5 | 9,576.2 | 7,106.9 | 5,524.0 | 5,075.4 | 4,483.4 | 3,628.9 | 4,393.1 | 5,048.8 | 5,460.0 | 6,594.1 | 9,940.2 |
| 2001 | 11,499.6 | 10,674.3 | 9,184.2 | 6,566.3 | 5,098.1 | 4,424.0 | 4,281.2 | 4,878.0 | 4,930.4 | W | 6,187.5 | 7,440.9 |
| 2002 | 8,752.5 | 7,981.5 | 6,794.1 | W | 4,649.9 | 3,624.1 | W | 3,840.8 | 4,038.8 | 5,230.0 | 6,757.1 | 8,791.7 |
| 2003 | 10,944.4 | 10,195.9 | 7,805.2 | 6,351.8 | 4,571.5 | W | W | W | 4,550.6 | 5,116.4 | 5,253.4 | 7,867.6 |
| 2004 | 10,237.4 | 8,726.0 | 6,760.5 | 5,216.9 | 3,770.7 | 4,047.3 | 3,310.2 | 3,633.2 | 3,907.0 | 4,587.2 | 5,647.2 | 7,389.9 |
| 2005 | 8,790.9 | 8,575.6 | 7,875.3 | 5,111.5 | 4,434.2 | 3,954.8 | 3,604.8 | 4,122.6 | 4,314.9 | 4,744.0 | 5,949.2 | 8,313.2 |
| 2006 | 7,740.0 | 8,067.6 | 7,618.3 | 5,291.1 | 4,812.7 | 4,472.7 | 3,828.6 | 4,395.2 | W | W | 5,877.1 | 6,452.9 |
| 2007 | 8,107.3 | 10,398.1 | 7,914.1 | 6,311.9 | W | 4,492.5 | 4,186.0 | W | W | 5,427.6 | 6,502.1 | 7,897.1 |
| 2008 | 8,122.0 | 8,135.7 | W | 5,238.0 | 4,330.1 | 4,067.3 | 3,907.8 | W | 4,544.2 | 5,382.0 | 5,506.8 | 7,682.3 |
| 2009 | 9,402.4 | 7,867.3 | 6,649.2 | 5,150.0 | 4,094.5 | 3,937.9 | 3,566.9 | 3,544.0 | 4,242.0 | 5,171.8 | 5,425.3 | 7,579.2 |
| 2010 | 8,108.5 | 8,153.6 | 6,122.2 | 4,651.9 | 4,262.5 | 4,289.2 | 3,819.2 | 4,053.8 | 4,600.1 | 4,787.4 | 5,989.6 | 8,335.6 |
| 2011 | W | W | 6,934.5 | 5,367.5 | 4,344.1 | 4,449.7 | 3,828.2 | 3,951.0 | 4,504.3 | 4,877.5 | 5,806.2 | 6,487.7 |
| 2012 | W | 6,823.9 | 5,300.4 | 4,508.7 | 4,293.7 | 3,898.9 | 3,786.7 | 4,075.7 | 4,157.2 | 5,002.8 | W | 6,504.3 |
| 2013 | 8,285.5 | 8,058.1 | 6,671.7 | 5,356.4 | 4,389.2 | 3,973.6 | 4,059.2 | 3,913.5 | 4,313.8 | 4,752.8 | 5,533.2 | 6,457.2 |
| 2014 | 7,773.0 | W | 6,328.0 | 4,617.0 | 4,002.0 | 3,685.9 | 3,778.8 | 3,599.0 | 4,328.8 | 4,630.7 | W | 6,346.0 |
| 2015 | W | W | 6,285.1 | 4,754.3 | W | 3,783.5 | 3,724.4 | 3,667.5 | 4,150.1 | 4,917.5 | 4,741.2 | 5,461.2 |
| 2016 | 6,495.5 | 6,579.6 | 5,387.1 | 4,790.5 | 4,223.3 | 4,042.3 | 3,548.5 | 3,928.7 | 4,130.0 | 4,453.5 | 4,979.7 | 6,270.7 |
| 2017 | 6,045.8 | 5,917.4 | 6,130.5 | 4,585.1 | 4,604.4 | 4,293.9 | 3,455.7 | 4,136.5 | 4,100.3 | 4,490.1 | 5,548.6 | 6,976.8 |
| 2018 | 8,577.0 | 6,588.0 | 5,838.5 | 5,484.5 | 4,297.6 | 4,245.9 | 3,978.6 | 3,997.3 | 4,123.3 | 5,072.8 | 5,953.6 | 6,356.1 |
| 2019 | 7,210.0 | 6,703.6 | 6,038.4 | 4,704.0 | 4,322.3 | 3,814.1 | 4,152.3 | 4,184.6 | 4,605.7 | 5,136.8 | 5,995.9 | 6,882.1 |
| 2020 | 7,098.0 | 6,556.9 | 5,908.7 | 4,992.9 | 4,324.6 | 3,998.7 | 3,852.0 | 3,913.0 | 4,408.1 | 4,520.3 | 5,099.4 | 6,753.1 |
| 2021 | 6,969.1 | W | 6,262.8 | 4,949.4 | 4,429.6 | 4,192.4 | 3,788.7 | 3,975.2 | 4,364.6 | 4,876.5 | 5,777.5 | 6,651.7 |
| 2022 | W | 7,801.9 | 6,487.5 | |||||||||
| - = No Data Reported; -- = Not Applicable; NA = Not Available; W = Withheld to avoid disclosure of individual company data. |
| Release Date: 5/19/2022 |
| Next Release Date: TBD |