|
Download Data (XLS File) |
|
||||||||
|
||||||||
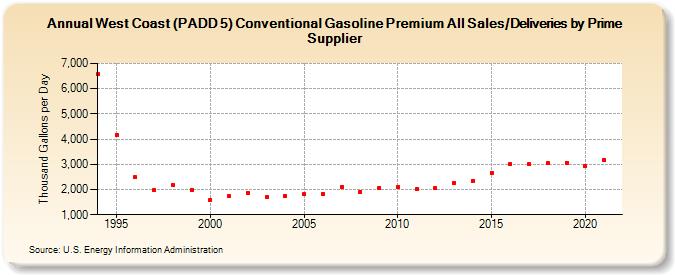
| West Coast (PADD 5) Conventional Gasoline Premium All Sales/Deliveries by Prime Supplier (Thousand Gallons per Day) | ||||||||
| Decade | Year-0 | Year-1 | Year-2 | Year-3 | Year-4 | Year-5 | Year-6 | Year-7 | Year-8 | Year-9 |
|---|---|---|---|---|---|---|---|---|---|---|
| 1990's | 6,575.1 | 4,178.3 | 2,478.7 | 1,973.4 | 2,179.2 | 1,993.6 | ||||
| 2000's | 1,598.1 | 1,726.8 | 1,877.7 | 1,694.2 | 1,733.0 | 1,817.5 | 1,815.5 | 2,102.7 | 1,915.3 | 2,063.8 |
| 2010's | 2,104.8 | 2,000.8 | 2,045.4 | 2,260.9 | 2,352.2 | 2,674.4 | 3,004.9 | 2,993.1 | 3,032.5 | 3,068.1 |
| 2020's | 2,945.3 |
| - = No Data Reported; -- = Not Applicable; NA = Not Available; W = Withheld to avoid disclosure of individual company data. |
| Release Date: 6/1/2022 |
| Next Release Date: TBD |