|
Download Data (XLS File) |
|
||||||||
|
||||||||
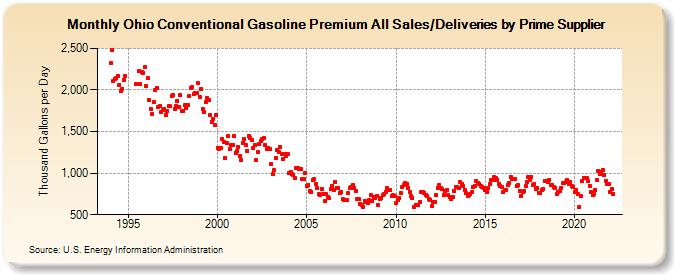
| Ohio Conventional Gasoline Premium All Sales/Deliveries by Prime Supplier (Thousand Gallons per Day) | ||||||||
| Year | Jan | Feb | Mar | Apr | May | Jun | Jul | Aug | Sep | Oct | Nov | Dec |
|---|---|---|---|---|---|---|---|---|---|---|---|---|
| 1993 | NA | NA | NA | |||||||||
| 1994 | 2,321.4 | 2,475.6 | 2,111.8 | 2,134.8 | 2,142.8 | 2,168.9 | 2,063.2 | 1,988.5 | 2,017.3 | 2,124.8 | 2,163.1 | W |
| 1995 | W | W | W | W | W | 2,070.6 | W | 2,225.4 | 2,076.2 | 2,212.5 | 2,207.4 | 2,270.3 |
| 1996 | 2,049.7 | 2,143.8 | 1,877.9 | 1,771.7 | 1,715.8 | 1,857.4 | 1,995.7 | 2,024.7 | 1,800.3 | 1,804.7 | 1,731.9 | 1,758.2 |
| 1997 | 1,766.9 | 1,700.9 | 1,746.9 | 1,801.4 | 1,802.0 | 1,927.9 | 1,933.7 | 1,774.4 | 1,804.5 | 1,868.4 | 1,799.7 | 1,933.7 |
| 1998 | 1,741.6 | 1,741.4 | 1,814.2 | 1,783.0 | 1,820.0 | 1,932.5 | 2,019.5 | 2,032.5 | 1,957.0 | 1,962.2 | 1,959.9 | 2,079.8 |
| 1999 | 1,918.8 | 2,009.3 | 1,765.3 | 1,733.5 | 1,854.8 | 1,902.3 | 1,874.8 | 1,703.9 | 1,618.1 | 1,649.2 | 1,580.0 | 1,703.7 |
| 2000 | 1,306.0 | 1,288.4 | 1,307.0 | 1,411.0 | 1,378.1 | 1,184.9 | 1,365.5 | 1,445.9 | 1,289.7 | 1,337.5 | 1,332.8 | 1,446.0 |
| 2001 | 1,244.8 | 1,263.9 | 1,308.8 | 1,201.6 | 1,152.1 | 1,366.1 | 1,407.5 | 1,337.4 | 1,271.1 | 1,452.5 | 1,421.5 | 1,401.9 |
| 2002 | 1,308.1 | 1,338.6 | 1,162.8 | 1,254.9 | 1,345.1 | 1,385.6 | 1,407.0 | 1,417.3 | 1,337.4 | 1,295.9 | 1,303.5 | 1,293.9 |
| 2003 | 1,106.9 | 989.5 | 1,032.1 | 1,186.0 | 1,273.2 | 1,257.7 | 1,311.6 | 1,231.8 | 1,167.3 | 1,226.7 | 1,208.8 | 1,229.7 |
| 2004 | 1,002.4 | 1,012.2 | 995.0 | 983.5 | 942.8 | 1,062.7 | 1,057.8 | 1,053.6 | 1,044.4 | 924.3 | 928.7 | 1,001.6 |
| 2005 | 847.2 | 859.8 | 779.9 | 777.9 | 920.5 | 925.6 | 871.7 | 816.8 | 748.5 | 742.9 | 808.9 | 748.3 |
| 2006 | 664.2 | 743.4 | 719.0 | 696.7 | 804.4 | 849.6 | 800.9 | 893.4 | 821.9 | 818.4 | 765.6 | 773.1 |
| 2007 | 691.0 | 674.1 | 672.8 | 682.7 | 755.2 | 827.2 | 828.9 | 862.6 | 826.7 | 783.5 | 692.2 | 683.5 |
| 2008 | 629.5 | 620.3 | 596.4 | 664.7 | 647.7 | 636.4 | 681.2 | 736.9 | 669.7 | 717.9 | 702.6 | 729.9 |
| 2009 | 615.0 | 690.0 | 697.5 | 735.3 | 751.1 | 773.3 | 815.6 | 791.7 | 798.8 | 719.7 | 732.6 | 724.5 |
| 2010 | 637.4 | 674.5 | 701.8 | 764.1 | 834.9 | 855.5 | 882.6 | 872.7 | 825.8 | 778.7 | 724.3 | 703.9 |
| 2011 | 590.8 | 621.2 | 618.2 | 611.2 | 654.3 | 770.0 | 774.5 | 759.5 | 740.7 | 721.5 | 686.8 | 677.7 |
| 2012 | 602.2 | 650.1 | 658.5 | 735.2 | 826.7 | 857.8 | 816.0 | 808.2 | 734.4 | 783.9 | 791.8 | 743.0 |
| 2013 | 710.9 | 693.9 | 708.5 | 790.7 | 835.1 | 836.1 | 817.1 | 895.2 | 869.8 | 845.1 | 794.7 | 762.9 |
| 2014 | 719.9 | 733.8 | 746.0 | 770.4 | 835.6 | 842.5 | 906.7 | 886.2 | 867.9 | 840.4 | 836.2 | 821.5 |
| 2015 | 792.1 | 772.9 | 819.8 | 867.7 | 918.0 | 915.2 | 951.4 | 941.2 | 923.4 | 872.0 | 849.0 | 830.8 |
| 2016 | 777.5 | 798.4 | 794.8 | 858.0 | 882.9 | 955.8 | 935.2 | 926.4 | 928.6 | 843.6 | 854.2 | 788.7 |
| 2017 | 729.4 | 770.4 | 786.8 | 839.9 | 896.7 | 949.5 | 917.5 | 957.1 | 857.5 | 867.4 | 810.4 | 820.7 |
| 2018 | 763.5 | 757.5 | 791.6 | 813.1 | 909.9 | 903.9 | 898.2 | 921.0 | 853.3 | 857.9 | 827.4 | 819.8 |
| 2019 | 750.9 | 774.6 | 780.4 | 826.3 | 879.2 | 885.1 | 896.1 | 923.2 | 866.7 | 899.3 | 844.1 | 839.2 |
| 2020 | 771.4 | 799.6 | 752.9 | 589.3 | 724.9 | 909.8 | 938.9 | 935.5 | 936.2 | 906.5 | 849.5 | 772.0 |
| 2021 | 736.4 | 754.6 | 799.6 | 914.6 | 1,030.9 | 991.1 | 1,015.3 | 1,042.1 | 979.8 | 908.5 | 870.3 | 873.6 |
| 2022 | 774.7 | 810.6 | 755.0 | |||||||||
| - = No Data Reported; -- = Not Applicable; NA = Not Available; W = Withheld to avoid disclosure of individual company data. |
| Release Date: 5/19/2022 |
| Next Release Date: TBD |