|
Download Data (XLS File) |
|
||||||||
|
||||||||
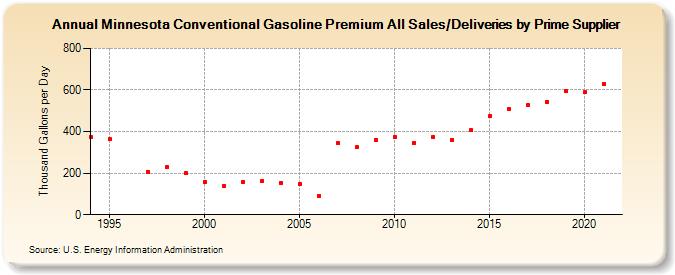
| Minnesota Conventional Gasoline Premium All Sales/Deliveries by Prime Supplier (Thousand Gallons per Day) | ||||||||
| Decade | Year-0 | Year-1 | Year-2 | Year-3 | Year-4 | Year-5 | Year-6 | Year-7 | Year-8 | Year-9 |
|---|---|---|---|---|---|---|---|---|---|---|
| 1990's | 373.3 | 362.6 | W | 206.4 | 228.4 | 198.8 | ||||
| 2000's | 157.0 | 140.5 | 155.9 | 161.8 | 154.2 | 149.3 | 90.7 | 344.1 | 323.6 | 361.5 |
| 2010's | 375.1 | 346.5 | 374.2 | 360.5 | 406.5 | 473.6 | 508.5 | 527.2 | 543.3 | 592.7 |
| 2020's | 588.0 |
| - = No Data Reported; -- = Not Applicable; NA = Not Available; W = Withheld to avoid disclosure of individual company data. |
| Release Date: 6/1/2022 |
| Next Release Date: TBD |