|
Download Data (XLS File) |
|
||||||||
|
||||||||
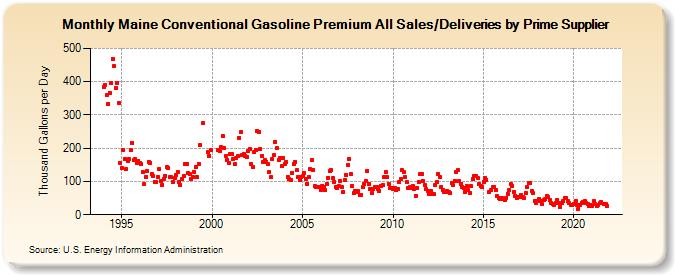
| Maine Conventional Gasoline Premium All Sales/Deliveries by Prime Supplier (Thousand Gallons per Day) | ||||||||
| Year | Jan | Feb | Mar | Apr | May | Jun | Jul | Aug | Sep | Oct | Nov | Dec |
|---|---|---|---|---|---|---|---|---|---|---|---|---|
| 1993 | NA | NA | NA | |||||||||
| 1994 | 382.5 | 389.3 | 359.9 | 333.0 | 366.7 | 396.4 | 468.9 | 447.1 | 381.9 | 396.4 | 336.8 | 156.3 |
| 1995 | 141.2 | 193.8 | 166.0 | 137.4 | 162.0 | 167.2 | 194.1 | 216.6 | 163.4 | 166.2 | 156.1 | 162.2 |
| 1996 | 156.8 | 151.7 | 127.2 | 92.5 | 114.7 | 131.3 | 159.6 | 156.5 | 123.2 | 115.8 | 99.3 | 97.4 |
| 1997 | 113.8 | 136.9 | 101.5 | 89.5 | 107.0 | 117.0 | 142.0 | 141.3 | 111.9 | 112.5 | 98.4 | 109.7 |
| 1998 | 120.4 | 128.7 | 98.0 | 89.0 | 108.0 | 115.4 | 151.1 | 153.9 | 125.0 | 120.9 | 108.4 | 112.5 |
| 1999 | 129.2 | 143.1 | 112.7 | 153.4 | 210.7 | W | 275.8 | W | W | 189.2 | 177.9 | 193.5 |
| 2000 | W | W | W | W | 195.3 | 190.7 | 203.4 | 237.0 | 199.4 | 176.8 | 165.9 | 154.1 |
| 2001 | 183.1 | 182.8 | 166.8 | 151.0 | 171.5 | 175.5 | 231.6 | 247.7 | 179.5 | 181.9 | 176.3 | 173.9 |
| 2002 | 190.6 | 197.6 | 153.9 | 144.8 | 188.0 | 194.1 | 251.0 | 249.7 | 197.5 | 177.8 | 158.4 | 164.0 |
| 2003 | 159.9 | 152.4 | 128.4 | 113.9 | 167.5 | 179.3 | 218.0 | 199.9 | 165.8 | 169.8 | 145.9 | 170.5 |
| 2004 | 152.3 | 159.9 | 114.4 | 107.5 | 105.4 | 125.1 | 152.2 | 159.5 | 133.1 | 113.0 | 104.8 | 114.1 |
| 2005 | 115.0 | 126.6 | 107.9 | 93.7 | 112.4 | 137.0 | 163.1 | 134.8 | 87.8 | 84.8 | 84.3 | 82.9 |
| 2006 | 75.4 | 87.5 | 84.5 | 73.9 | 90.9 | 111.3 | 130.8 | 134.4 | 110.2 | 98.5 | 83.7 | 81.7 |
| 2007 | 85.8 | 102.2 | 82.0 | 68.8 | 103.8 | 120.3 | 150.7 | 167.9 | 122.5 | 87.6 | 64.4 | 72.2 |
| 2008 | 67.8 | 70.4 | 58.3 | 59.7 | 83.5 | 93.1 | 101.0 | 131.7 | 91.8 | 76.7 | 65.5 | 78.4 |
| 2009 | 83.7 | 84.4 | 76.5 | 71.9 | 87.4 | 88.7 | 112.5 | 127.9 | 111.9 | 92.8 | 79.3 | 81.6 |
| 2010 | 77.4 | 79.1 | 73.3 | 77.6 | 98.7 | 106.8 | 134.7 | 128.1 | 112.8 | 97.2 | 80.9 | 83.0 |
| 2011 | 79.1 | 86.6 | 76.7 | 57.6 | 81.6 | 98.7 | 123.3 | 123.8 | 100.2 | 88.4 | 75.9 | 72.6 |
| 2012 | 62.5 | 70.3 | 63.7 | 60.9 | 89.1 | 97.6 | 122.1 | 114.4 | 83.5 | 75.5 | 67.9 | 68.0 |
| 2013 | 71.4 | 66.9 | 64.2 | 94.5 | 89.0 | 101.2 | 129.3 | 134.0 | 100.9 | 93.7 | 83.6 | 79.9 |
| 2014 | 68.9 | 85.7 | 73.3 | 64.8 | 85.4 | 106.5 | 116.6 | 115.8 | 110.8 | 91.4 | 85.2 | 82.1 |
| 2015 | 99.6 | 109.8 | 105.6 | W | 67.2 | 72.8 | 82.3 | 83.8 | 73.7 | 55.8 | 51.0 | 47.8 |
| 2016 | 49.2 | 48.7 | 45.2 | 51.6 | 63.2 | 73.2 | 91.3 | 87.5 | 68.9 | 56.6 | 50.2 | 52.5 |
| 2017 | 54.4 | 59.9 | 54.1 | 50.1 | 63.9 | 82.0 | 94.8 | 96.1 | 72.6 | 64.0 | 41.6 | 34.9 |
| 2018 | 42.3 | 47.4 | 41.3 | 31.6 | 44.1 | 47.9 | 55.7 | 53.4 | 44.1 | 35.7 | 32.8 | 30.4 |
| 2019 | 35.8 | 45.1 | 36.5 | 24.6 | 34.1 | 40.0 | 51.4 | 49.7 | 41.0 | 34.8 | 30.0 | 29.9 |
| 2020 | 32.5 | 41.1 | 28.3 | 18.6 | 28.8 | 36.1 | 38.1 | 41.2 | 35.6 | 33.4 | 26.9 | 28.1 |
| 2021 | 26.6 | 41.4 | 32.6 | 27.0 | 30.6 | 34.4 | 37.3 | W | 32.0 | 33.6 | 26.2 | W |
| 2022 | W | W | W | |||||||||
| - = No Data Reported; -- = Not Applicable; NA = Not Available; W = Withheld to avoid disclosure of individual company data. |
| Release Date: 5/19/2022 |
| Next Release Date: TBD |