|
Download Data (XLS File) |
|
||||||||
|
||||||||
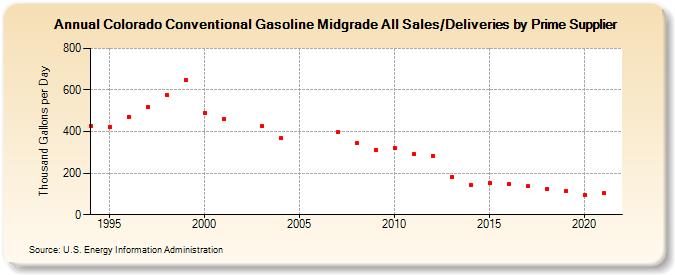
| Colorado Conventional Gasoline Midgrade All Sales/Deliveries by Prime Supplier (Thousand Gallons per Day) | ||||||||
| Decade | Year-0 | Year-1 | Year-2 | Year-3 | Year-4 | Year-5 | Year-6 | Year-7 | Year-8 | Year-9 |
|---|---|---|---|---|---|---|---|---|---|---|
| 1990's | 428.7 | 421.1 | 471.8 | 518.1 | 574.7 | 649.2 | ||||
| 2000's | 490.4 | 458.1 | W | 427.5 | 367.5 | W | W | 396.1 | 343.0 | 312.9 |
| 2010's | 321.6 | 292.5 | 283.5 | 182.7 | 143.8 | 151.4 | 147.3 | 136.9 | 123.2 | 113.6 |
| 2020's | 95.3 |
| - = No Data Reported; -- = Not Applicable; NA = Not Available; W = Withheld to avoid disclosure of individual company data. |
| Release Date: 6/1/2022 |
| Next Release Date: TBD |