|
Download Data (XLS File) |
|
||||||||
|
||||||||
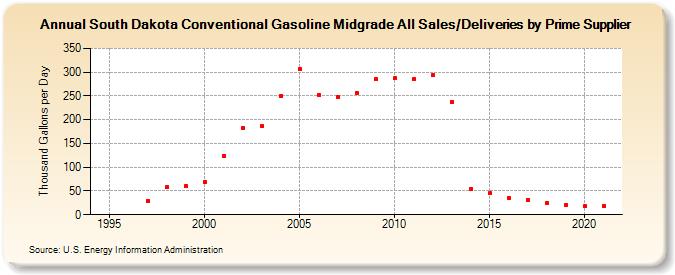
| South Dakota Conventional Gasoline Midgrade All Sales/Deliveries by Prime Supplier (Thousand Gallons per Day) | ||||||||
| Decade | Year-0 | Year-1 | Year-2 | Year-3 | Year-4 | Year-5 | Year-6 | Year-7 | Year-8 | Year-9 |
|---|---|---|---|---|---|---|---|---|---|---|
| 1990's | W | W | W | 29.8 | 57.6 | 60.3 | ||||
| 2000's | 68.7 | 123.9 | 183.0 | 187.2 | 250.5 | 306.4 | 252.4 | 248.2 | 257.1 | 285.4 |
| 2010's | 287.2 | 284.8 | 294.3 | 237.3 | 55.1 | 44.7 | 34.5 | 30.7 | 25.5 | 20.7 |
| 2020's | 18.0 |
| - = No Data Reported; -- = Not Applicable; NA = Not Available; W = Withheld to avoid disclosure of individual company data. |
| Release Date: 6/1/2022 |
| Next Release Date: TBD |