|
Download Data (XLS File) |
|
||||||||
|
||||||||
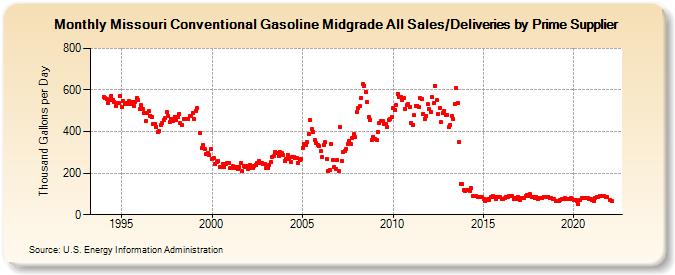
| Missouri Conventional Gasoline Midgrade All Sales/Deliveries by Prime Supplier (Thousand Gallons per Day) | ||||||||
| Year | Jan | Feb | Mar | Apr | May | Jun | Jul | Aug | Sep | Oct | Nov | Dec |
|---|---|---|---|---|---|---|---|---|---|---|---|---|
| 1993 | NA | NA | NA | |||||||||
| 1994 | 568.1 | 562.5 | 556.7 | 539.1 | 552.4 | 571.8 | 551.6 | 541.8 | 525.2 | 538.0 | 539.2 | 571.0 |
| 1995 | 520.0 | 546.9 | 534.7 | 537.6 | 530.5 | 546.8 | 532.4 | 543.3 | 524.9 | 544.5 | 563.0 | 552.3 |
| 1996 | 509.5 | 525.7 | 506.3 | 488.7 | 450.0 | 487.5 | 496.5 | 477.2 | 468.1 | 437.5 | 436.3 | 422.3 |
| 1997 | 399.7 | 401.5 | 430.0 | 439.6 | 456.8 | 465.5 | 491.9 | 474.8 | 447.4 | 461.6 | 451.5 | 471.8 |
| 1998 | 457.4 | 470.1 | 484.8 | 439.6 | 430.6 | 460.1 | 459.3 | 460.3 | 458.5 | 474.7 | 473.1 | 490.4 |
| 1999 | 460.3 | 499.1 | 514.2 | W | 393.9 | 323.2 | 335.2 | 317.5 | 290.5 | 296.6 | 289.0 | 314.2 |
| 2000 | 268.3 | 271.1 | 246.1 | 254.4 | 258.4 | 229.8 | 228.6 | 243.7 | 228.3 | 243.1 | 251.1 | 247.6 |
| 2001 | 222.6 | 223.3 | 232.8 | 223.2 | 228.9 | 222.2 | 229.9 | 248.5 | 209.9 | 233.1 | 229.1 | 232.9 |
| 2002 | 218.8 | 238.0 | 226.1 | 226.5 | 233.9 | 241.0 | 248.2 | 256.6 | 246.9 | 247.1 | 242.0 | 242.6 |
| 2003 | 224.9 | 224.1 | 240.9 | 253.4 | 277.2 | 282.5 | 303.1 | 298.5 | 281.8 | 303.1 | 297.7 | 288.2 |
| 2004 | 260.1 | 266.9 | 288.7 | 266.7 | 255.2 | 277.9 | 276.0 | 275.0 | 274.9 | 250.1 | 261.9 | 268.6 |
| 2005 | 321.5 | 340.8 | 336.4 | 349.0 | 389.0 | 455.8 | 410.2 | 399.4 | 360.4 | 345.9 | 336.5 | 329.3 |
| 2006 | 305.6 | 277.3 | 334.8 | 349.1 | 267.3 | 210.8 | 215.4 | 340.9 | 263.6 | 228.4 | 220.3 | 263.0 |
| 2007 | 209.9 | 421.7 | 257.8 | 303.7 | 307.1 | 318.2 | 340.9 | 356.5 | 340.5 | 368.5 | 386.3 | 373.4 |
| 2008 | 492.7 | 513.8 | 521.4 | 563.1 | 626.9 | 621.4 | 592.0 | 541.1 | 468.5 | 457.9 | 358.7 | 374.7 |
| 2009 | 364.6 | 357.7 | 397.9 | 440.8 | 450.4 | 448.7 | 436.1 | 434.9 | 421.0 | 457.0 | 459.9 | 467.8 |
| 2010 | 511.0 | 502.2 | 526.3 | 582.1 | 565.9 | 564.3 | 553.6 | 560.2 | 508.7 | 526.3 | 531.3 | 519.2 |
| 2011 | 441.7 | 430.3 | 478.4 | 525.2 | 524.9 | 520.1 | 560.4 | 555.8 | 486.1 | 462.4 | 476.4 | 531.2 |
| 2012 | 507.7 | 495.0 | 564.7 | 535.4 | 619.6 | 549.9 | 485.2 | 513.8 | 444.4 | 488.6 | 499.6 | 477.3 |
| 2013 | 481.0 | 421.2 | 433.6 | 477.2 | 458.3 | 532.1 | 608.5 | 539.2 | 348.3 | 147.5 | 147.3 | 120.6 |
| 2014 | 113.1 | 117.0 | 117.6 | 115.8 | 127.1 | 90.8 | 90.6 | 89.9 | 86.5 | 85.0 | 84.4 | 83.2 |
| 2015 | 74.0 | 65.3 | 69.1 | 73.8 | 71.7 | 85.5 | 89.4 | 86.0 | 74.6 | 83.8 | 84.0 | 84.9 |
| 2016 | 77.1 | 77.2 | 78.5 | 86.8 | 86.5 | 89.2 | 91.1 | 89.1 | 75.9 | 78.2 | 77.9 | 85.4 |
| 2017 | 68.8 | 78.1 | 80.6 | 82.0 | 91.2 | 93.6 | 91.3 | 98.1 | 83.3 | 83.6 | 80.9 | 85.0 |
| 2018 | 75.5 | 78.0 | 80.9 | 82.5 | 87.5 | 85.7 | 83.9 | 85.7 | 78.7 | 79.9 | 75.6 | 75.3 |
| 2019 | 65.9 | 67.1 | 65.8 | 72.5 | 75.2 | 76.6 | 78.0 | 76.7 | 74.7 | 77.2 | 78.5 | 75.6 |
| 2020 | 69.9 | 69.3 | 64.0 | 50.6 | 68.6 | 79.3 | 82.7 | 80.9 | 80.3 | 82.3 | 76.6 | 77.2 |
| 2021 | 68.5 | 67.6 | 78.4 | 84.2 | 85.2 | 90.7 | 89.3 | 90.2 | 87.9 | 83.1 | 83.8 | W |
| 2022 | 72.9 | 66.0 | W | |||||||||
| - = No Data Reported; -- = Not Applicable; NA = Not Available; W = Withheld to avoid disclosure of individual company data. |
| Release Date: 5/19/2022 |
| Next Release Date: TBD |