|
Download Data (XLS File) |
|
||||||||
|
||||||||
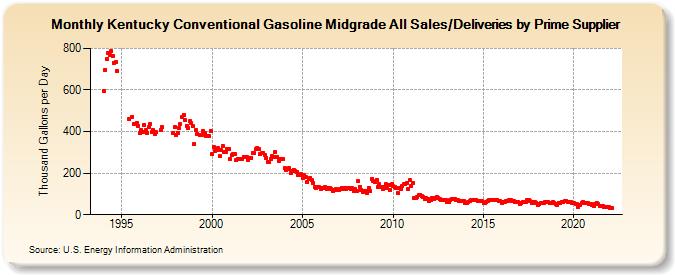
| Kentucky Conventional Gasoline Midgrade All Sales/Deliveries by Prime Supplier (Thousand Gallons per Day) | ||||||||
| Year | Jan | Feb | Mar | Apr | May | Jun | Jul | Aug | Sep | Oct | Nov | Dec |
|---|---|---|---|---|---|---|---|---|---|---|---|---|
| 1993 | NA | NA | NA | |||||||||
| 1994 | 594.8 | 697.9 | 748.3 | 777.9 | 768.6 | 787.3 | 764.1 | 731.0 | 734.2 | 691.5 | W | W |
| 1995 | W | W | W | W | W | 461.0 | W | 471.0 | 436.8 | W | 443.5 | 426.4 |
| 1996 | 394.2 | 408.2 | 398.4 | 432.4 | 405.4 | 394.5 | 419.7 | 437.1 | 396.4 | 405.2 | 389.7 | 396.6 |
| 1997 | W | W | 406.9 | 420.7 | W | W | W | W | W | W | 392.0 | 420.1 |
| 1998 | 381.1 | 394.5 | 415.4 | 435.9 | 469.7 | 482.0 | 454.2 | 428.5 | 416.8 | 449.3 | 439.7 | 424.4 |
| 1999 | 341.3 | 406.2 | 389.0 | W | 385.4 | 382.1 | 403.0 | 393.8 | 376.7 | 378.6 | 378.1 | 404.4 |
| 2000 | 293.0 | 324.4 | 306.7 | 312.9 | 319.5 | 281.7 | 310.1 | 330.1 | 302.0 | 303.1 | 314.8 | 316.6 |
| 2001 | 269.1 | 286.2 | 293.9 | 290.5 | 260.9 | 265.8 | 268.8 | 266.4 | 268.7 | 278.3 | 277.5 | 275.4 |
| 2002 | 265.0 | 270.8 | 273.9 | 297.3 | 295.7 | 316.0 | 321.8 | 317.4 | 290.0 | 295.5 | 297.2 | 288.6 |
| 2003 | 273.0 | 254.1 | 255.4 | 265.6 | 280.2 | 279.4 | 301.5 | 279.4 | 260.7 | 269.6 | 267.1 | 268.9 |
| 2004 | 223.7 | 216.9 | 219.1 | 223.4 | 202.4 | 208.1 | 217.4 | 209.4 | 205.1 | 193.4 | 191.9 | 195.5 |
| 2005 | 177.4 | 188.7 | 180.2 | 157.9 | 171.8 | 178.4 | 165.5 | 151.8 | 134.6 | 129.0 | 132.0 | 131.8 |
| 2006 | 123.1 | 126.9 | 129.3 | 130.9 | 126.0 | 126.9 | 130.0 | 123.7 | 114.2 | 117.9 | 122.3 | 118.6 |
| 2007 | 120.4 | 124.2 | 130.4 | 122.1 | 129.5 | 124.3 | 130.1 | 127.3 | 121.5 | 126.9 | 114.2 | 122.2 |
| 2008 | 115.3 | 160.5 | 134.9 | 120.0 | 109.3 | 113.9 | 115.4 | 102.2 | 130.2 | 114.3 | 173.4 | 161.8 |
| 2009 | 157.9 | 168.1 | 133.3 | 145.4 | 135.6 | 122.2 | 133.3 | 146.3 | 126.1 | 145.3 | 120.9 | 145.7 |
| 2010 | 136.1 | 133.9 | 128.1 | 102.4 | 127.9 | 123.2 | 138.3 | 146.1 | 146.8 | 153.5 | 121.8 | 165.5 |
| 2011 | 137.5 | 153.8 | 82.7 | 80.6 | 83.9 | 92.5 | 95.0 | 89.0 | 84.1 | 74.7 | 78.0 | 76.3 |
| 2012 | 64.5 | 72.7 | 79.6 | 73.8 | 78.2 | 84.8 | 82.0 | 74.1 | 68.6 | 71.5 | 70.2 | 69.5 |
| 2013 | 62.5 | 63.2 | 70.8 | 75.8 | 74.1 | 73.7 | 69.8 | 70.1 | 68.3 | 66.5 | 65.2 | 64.4 |
| 2014 | 57.1 | 58.6 | 62.7 | 65.7 | 70.8 | 71.7 | 72.8 | 71.0 | 66.0 | 66.5 | 65.0 | 64.1 |
| 2015 | 58.5 | 57.4 | 63.3 | 68.3 | 70.4 | 71.7 | 73.0 | 72.5 | 69.4 | 72.4 | 67.2 | 63.8 |
| 2016 | 56.9 | 58.9 | 62.0 | 64.1 | 64.4 | 69.2 | 72.4 | 67.4 | 65.3 | 62.0 | 61.8 | 61.3 |
| 2017 | 52.5 | 55.7 | 61.7 | 62.3 | 62.6 | 69.2 | 69.6 | 65.3 | 57.9 | 60.8 | 59.4 | 56.7 |
| 2018 | 48.0 | 51.0 | 57.3 | 56.0 | 58.3 | 63.1 | 63.4 | 62.1 | 55.9 | 57.3 | 60.0 | 56.9 |
| 2019 | 49.6 | 48.8 | 54.0 | 56.3 | 63.1 | 62.8 | 63.8 | 65.6 | 60.7 | 60.3 | 59.0 | 57.8 |
| 2020 | 54.0 | 53.7 | 50.7 | 37.4 | 45.8 | 58.4 | 60.3 | 57.2 | 56.7 | 56.6 | 50.9 | 49.7 |
| 2021 | 46.4 | 43.8 | 53.9 | 57.9 | 49.7 | 43.4 | 43.1 | 40.7 | 36.1 | 35.4 | 36.9 | 36.5 |
| 2022 | 31.5 | 32.9 | W | |||||||||
| - = No Data Reported; -- = Not Applicable; NA = Not Available; W = Withheld to avoid disclosure of individual company data. |
| Release Date: 5/19/2022 |
| Next Release Date: TBD |