|
Download Data (XLS File) |
|
||||||||
|
||||||||
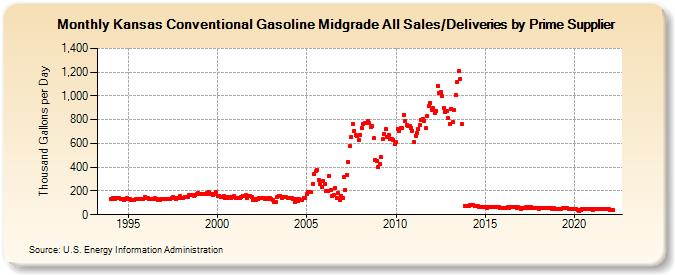
| Kansas Conventional Gasoline Midgrade All Sales/Deliveries by Prime Supplier (Thousand Gallons per Day) | ||||||||
| Year | Jan | Feb | Mar | Apr | May | Jun | Jul | Aug | Sep | Oct | Nov | Dec |
|---|---|---|---|---|---|---|---|---|---|---|---|---|
| 1993 | NA | NA | NA | |||||||||
| 1994 | 130.8 | 136.0 | 136.8 | 133.4 | 139.4 | 141.1 | 140.2 | 134.1 | 130.2 | 127.5 | 131.7 | 139.5 |
| 1995 | 129.1 | 128.5 | 126.0 | 124.5 | 122.8 | 131.6 | 131.5 | 131.1 | 130.0 | 134.6 | 135.4 | 144.9 |
| 1996 | 138.8 | 140.7 | 135.7 | 132.4 | 132.7 | 134.8 | 137.5 | 130.0 | 127.9 | 127.5 | 134.7 | 135.2 |
| 1997 | 129.3 | 129.2 | 130.7 | 133.3 | 134.3 | 138.4 | 146.9 | 140.8 | 132.4 | 141.5 | 144.4 | 154.9 |
| 1998 | 142.1 | 138.8 | 151.8 | 146.8 | 149.5 | 163.6 | 161.8 | 164.4 | 160.9 | 163.1 | 172.1 | 182.6 |
| 1999 | 172.6 | 176.6 | 174.1 | 170.4 | 178.0 | 182.9 | 193.3 | 174.2 | 171.1 | 168.7 | 173.4 | 189.0 |
| 2000 | 159.7 | 160.7 | 145.8 | 150.2 | 156.6 | 137.2 | 139.6 | 152.5 | 148.1 | 141.2 | 152.1 | 155.0 |
| 2001 | 138.8 | 137.9 | 139.5 | 137.2 | 146.7 | 156.0 | 154.4 | 161.9 | 144.7 | 154.6 | 156.5 | 151.5 |
| 2002 | 120.6 | 131.9 | 121.3 | 128.3 | 138.7 | 143.4 | 142.0 | 143.4 | 133.3 | 133.4 | 136.8 | 141.5 |
| 2003 | 133.8 | 126.3 | 111.1 | 106.2 | 148.2 | 158.9 | 161.5 | 143.5 | 146.9 | 150.2 | 148.9 | 143.2 |
| 2004 | 138.7 | 141.7 | 141.0 | 136.2 | 111.0 | 128.3 | 117.5 | 131.5 | 126.1 | 121.7 | 139.9 | 139.1 |
| 2005 | 174.0 | 187.6 | 191.4 | 188.7 | 259.4 | 339.2 | 365.4 | 376.2 | 289.4 | 257.8 | 229.8 | 279.9 |
| 2006 | 258.6 | 196.4 | 200.0 | 328.1 | 210.9 | 160.8 | 166.5 | 228.4 | 141.0 | 184.0 | 127.9 | 161.7 |
| 2007 | 140.1 | 318.0 | 211.3 | 337.5 | 442.0 | 575.2 | 652.5 | 766.2 | 705.3 | 672.0 | 666.4 | 630.7 |
| 2008 | 672.1 | 730.5 | 764.7 | 771.9 | 769.6 | 786.3 | 771.4 | 738.6 | 746.0 | 643.3 | 459.4 | 450.9 |
| 2009 | 403.0 | 425.4 | 484.0 | 633.8 | 677.7 | 719.2 | 654.8 | 672.5 | 633.3 | 638.4 | 631.4 | 591.3 |
| 2010 | 608.8 | 718.3 | 703.5 | 729.6 | 729.1 | 842.7 | 790.0 | 753.0 | 749.2 | 746.6 | 730.5 | 707.7 |
| 2011 | 608.5 | 665.7 | 687.0 | 719.5 | 756.3 | 801.3 | 801.8 | 793.0 | 726.9 | 830.3 | 915.3 | 940.3 |
| 2012 | 884.4 | 897.8 | 857.8 | 874.1 | 1,083.6 | 1,025.3 | 1,032.6 | 995.2 | 894.4 | 866.1 | 871.7 | 811.5 |
| 2013 | 759.7 | 892.1 | 780.3 | 881.0 | 1,007.9 | 1,116.2 | 1,208.1 | 1,145.0 | 766.6 | NA | 73.7 | 74.4 |
| 2014 | 72.0 | 76.9 | 79.5 | 82.3 | 80.9 | 70.9 | 72.5 | 70.5 | 63.8 | 64.9 | 66.6 | 65.3 |
| 2015 | 62.3 | 60.5 | 61.3 | 66.2 | 62.8 | 62.4 | 64.1 | 61.4 | 61.8 | 61.8 | 57.7 | 60.3 |
| 2016 | 57.8 | 60.0 | 58.2 | 60.9 | 60.5 | 62.5 | 65.0 | 63.6 | 63.1 | 59.7 | 60.8 | 59.5 |
| 2017 | 52.0 | 54.8 | 56.9 | 61.1 | 60.3 | 61.8 | 59.5 | 61.8 | 54.7 | 56.8 | 54.4 | 56.0 |
| 2018 | 50.5 | 53.3 | 53.5 | 56.7 | 53.8 | 55.9 | 53.6 | 56.0 | 52.9 | 50.5 | 54.5 | 51.0 |
| 2019 | 47.5 | 48.1 | 51.8 | 52.3 | 53.0 | 54.9 | 52.7 | 53.6 | 52.1 | 52.2 | 51.0 | 50.7 |
| 2020 | 46.2 | 48.7 | 41.6 | 31.6 | 40.8 | 48.6 | 49.6 | 48.0 | 48.0 | 47.9 | 45.4 | 46.9 |
| 2021 | 42.5 | 45.6 | 46.2 | 47.0 | 46.6 | 48.5 | 47.3 | 48.2 | 47.0 | 46.5 | 46.9 | 46.4 |
| 2022 | 39.3 | 41.1 | 36.5 | |||||||||
| - = No Data Reported; -- = Not Applicable; NA = Not Available; W = Withheld to avoid disclosure of individual company data. |
| Release Date: 5/19/2022 |
| Next Release Date: TBD |