|
Download Data (XLS File) |
|
||||||||
|
||||||||
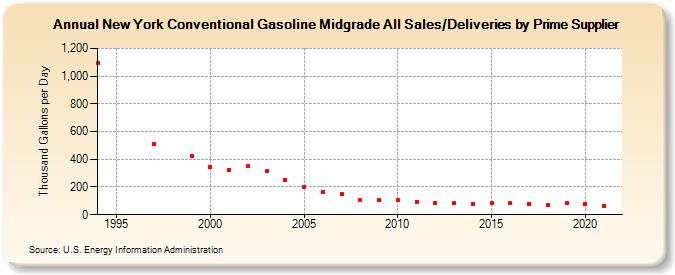
| New York Conventional Gasoline Midgrade All Sales/Deliveries by Prime Supplier (Thousand Gallons per Day) | ||||||||
| Decade | Year-0 | Year-1 | Year-2 | Year-3 | Year-4 | Year-5 | Year-6 | Year-7 | Year-8 | Year-9 |
|---|---|---|---|---|---|---|---|---|---|---|
| 1990's | 1,094.9 | W | W | 510.8 | W | 426.3 | ||||
| 2000's | 341.9 | 324.0 | 348.4 | 312.0 | 253.5 | 200.5 | 166.2 | 146.6 | 105.4 | 103.0 |
| 2010's | 103.4 | 95.3 | 86.8 | 83.3 | 80.4 | 82.2 | 81.0 | 79.5 | 68.8 | 85.4 |
| 2020's | 79.1 |
| - = No Data Reported; -- = Not Applicable; NA = Not Available; W = Withheld to avoid disclosure of individual company data. |
| Release Date: 6/1/2022 |
| Next Release Date: TBD |