|
Download Data (XLS File) |
|
||||||||
|
||||||||
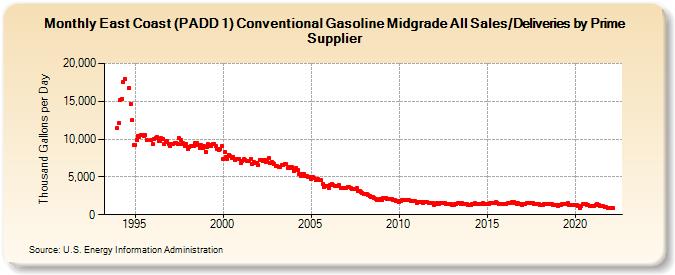
| East Coast (PADD 1) Conventional Gasoline Midgrade All Sales/Deliveries by Prime Supplier (Thousand Gallons per Day) | ||||||||
| Year | Jan | Feb | Mar | Apr | May | Jun | Jul | Aug | Sep | Oct | Nov | Dec |
|---|---|---|---|---|---|---|---|---|---|---|---|---|
| 1993 | NA | NA | NA | |||||||||
| 1994 | 11,456.6 | 12,112.9 | 15,181.0 | 15,337.6 | 17,514.3 | 18,009.3 | W | W | 16,772.9 | 14,675.0 | 12,512.9 | 9,238.1 |
| 1995 | 9,271.0 | 9,853.5 | 10,354.1 | 10,322.1 | 10,508.9 | 10,484.7 | 10,363.9 | 10,550.2 | 9,868.1 | W | W | 9,887.9 |
| 1996 | 9,323.5 | 10,056.2 | 10,157.2 | 10,223.6 | 9,794.3 | 9,722.1 | 10,083.3 | 9,991.8 | 9,359.4 | 9,636.7 | 9,697.4 | 9,374.5 |
| 1997 | 9,070.0 | 9,369.3 | 9,413.0 | 9,462.4 | 9,467.8 | 9,371.5 | 10,103.0 | 9,912.4 | 9,292.2 | 9,422.1 | 9,114.5 | 9,380.6 |
| 1998 | 8,697.5 | 8,922.6 | 9,081.7 | 9,109.1 | 9,104.4 | 9,490.3 | 9,479.0 | 9,238.1 | 8,857.9 | 9,187.1 | 8,793.5 | 9,028.1 |
| 1999 | 8,352.7 | 8,974.6 | 9,343.4 | 9,234.7 | 9,064.9 | 9,326.2 | 9,364.9 | 9,099.8 | 8,702.6 | 8,564.9 | 8,751.8 | 9,054.0 |
| 2000 | 7,343.8 | 8,269.4 | 7,654.6 | 7,373.8 | 7,878.9 | 7,754.6 | 7,451.3 | 7,647.6 | 7,194.8 | 7,308.5 | 7,314.1 | 7,342.1 |
| 2001 | 6,858.0 | 7,165.3 | 7,331.4 | 7,209.8 | 7,116.6 | 7,099.9 | 7,083.3 | 7,397.6 | 6,731.9 | 6,910.7 | 6,823.5 | 6,806.6 |
| 2002 | 6,568.8 | 7,181.9 | 7,207.2 | 7,063.3 | 7,196.9 | 7,011.5 | 7,281.2 | 7,446.4 | 6,789.6 | 7,031.5 | 6,816.4 | 6,747.6 |
| 2003 | 6,425.5 | 6,413.4 | 6,267.5 | 6,364.1 | 6,570.8 | 6,557.3 | 6,760.3 | 6,660.4 | 6,112.4 | 6,276.3 | 6,134.5 | 6,262.1 |
| 2004 | 5,800.2 | 5,934.2 | 6,150.6 | 5,869.4 | 5,423.8 | 5,152.1 | 5,324.0 | 5,432.2 | 5,137.9 | 5,080.8 | 4,988.5 | 5,025.5 |
| 2005 | 4,698.2 | 4,964.8 | 4,888.1 | 4,585.2 | 4,652.7 | 4,667.7 | 4,639.5 | 4,556.5 | 4,017.8 | 3,664.0 | 3,835.2 | 3,823.6 |
| 2006 | 3,546.8 | 3,915.3 | 4,034.5 | 3,873.9 | 3,773.2 | 3,834.9 | 3,802.8 | 3,916.0 | 3,528.4 | 3,515.7 | 3,518.6 | 3,535.4 |
| 2007 | 3,467.7 | 3,602.0 | 3,629.2 | 3,476.0 | 3,425.7 | 3,387.0 | 3,382.2 | 3,479.3 | 3,186.1 | 3,138.2 | 2,949.9 | 2,862.6 |
| 2008 | 2,682.0 | 2,797.0 | 2,711.0 | 2,619.4 | 2,530.7 | 2,343.5 | 2,287.8 | 2,234.0 | 2,111.0 | 1,996.6 | 1,965.5 | 2,085.8 |
| 2009 | 1,998.0 | 2,177.2 | 2,192.5 | 2,252.7 | 2,143.5 | 2,143.0 | 2,129.3 | 2,063.9 | 1,930.0 | 1,901.4 | 1,848.4 | 1,871.3 |
| 2010 | 1,745.9 | 1,856.8 | 1,912.3 | 1,963.7 | 1,942.7 | 1,940.3 | 1,955.8 | 1,913.3 | 1,823.5 | 1,814.3 | 1,779.6 | 1,754.0 |
| 2011 | 1,552.6 | 1,664.1 | 1,647.2 | 1,627.1 | 1,591.6 | 1,640.6 | 1,647.2 | 1,676.4 | 1,528.6 | 1,505.0 | 1,525.0 | 1,512.3 |
| 2012 | 1,350.5 | 1,442.2 | 1,496.0 | 1,468.0 | 1,497.5 | 1,551.0 | 1,558.2 | 1,551.1 | 1,386.8 | 1,419.4 | 1,418.5 | 1,371.3 |
| 2013 | 1,338.4 | 1,344.8 | 1,423.3 | 1,442.5 | 1,495.7 | 1,497.7 | 1,480.0 | 1,512.6 | 1,414.4 | 1,412.2 | 1,371.1 | 1,343.4 |
| 2014 | 1,251.8 | 1,307.0 | 1,404.0 | 1,436.6 | 1,503.3 | 1,465.8 | 1,480.9 | 1,476.4 | 1,371.1 | 1,483.3 | 1,438.4 | 1,422.7 |
| 2015 | 1,359.7 | 1,393.9 | 1,485.2 | 1,534.3 | 1,556.6 | 1,591.0 | 1,626.4 | 1,563.6 | 1,476.6 | 1,454.2 | 1,446.6 | 1,419.4 |
| 2016 | 1,366.6 | 1,432.3 | 1,515.2 | 1,535.7 | 1,536.7 | 1,622.9 | 1,626.9 | 1,594.9 | 1,467.0 | 1,501.5 | 1,414.6 | 1,395.8 |
| 2017 | 1,284.9 | 1,375.5 | 1,452.1 | 1,518.8 | 1,559.6 | 1,559.3 | 1,564.5 | 1,561.5 | 1,399.0 | 1,405.9 | 1,385.6 | 1,360.0 |
| 2018 | 1,227.3 | 1,315.6 | 1,331.4 | 1,358.4 | 1,396.7 | 1,452.2 | 1,408.3 | 1,429.8 | 1,354.8 | 1,330.8 | 1,320.3 | 1,234.7 |
| 2019 | 1,193.9 | 1,243.8 | 1,320.2 | 1,352.2 | 1,472.5 | 1,421.3 | 1,470.4 | 1,484.9 | 1,341.1 | 1,327.6 | 1,297.1 | 1,249.7 |
| 2020 | 1,229.2 | 1,245.2 | 1,212.4 | 898.3 | 1,203.3 | 1,364.8 | 1,451.4 | 1,368.6 | 1,319.6 | 1,277.0 | 1,204.7 | 1,185.0 |
| 2021 | 1,126.1 | 1,181.5 | 1,280.2 | 1,390.7 | 1,269.2 | 1,213.8 | 1,215.3 | 1,135.5 | 1,026.1 | 989.2 | 930.9 | 925.8 |
| 2022 | 847.4 | 909.6 | 847.6 | |||||||||
| - = No Data Reported; -- = Not Applicable; NA = Not Available; W = Withheld to avoid disclosure of individual company data. |
| Release Date: 5/19/2022 |
| Next Release Date: TBD |