|
Download Data (XLS File) |
|
||||||||
|
||||||||
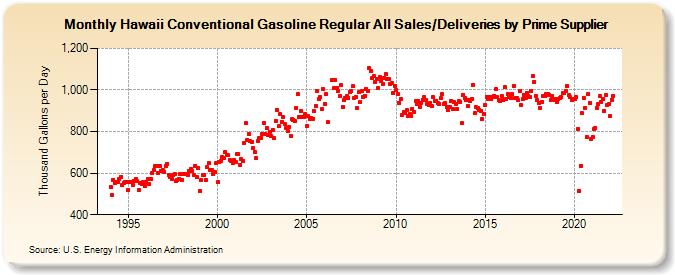
| Hawaii Conventional Gasoline Regular All Sales/Deliveries by Prime Supplier (Thousand Gallons per Day) | ||||||||
| Year | Jan | Feb | Mar | Apr | May | Jun | Jul | Aug | Sep | Oct | Nov | Dec |
|---|---|---|---|---|---|---|---|---|---|---|---|---|
| 1993 | NA | NA | NA | |||||||||
| 1994 | 535.7 | 493.4 | 565.8 | 554.7 | 556.6 | 557.6 | 570.5 | 583.8 | 544.0 | 553.1 | 559.3 | 556.4 |
| 1995 | 520.3 | 555.5 | 558.0 | 543.0 | 560.9 | 572.8 | 559.8 | 518.3 | 553.0 | 549.7 | 558.1 | 540.1 |
| 1996 | 555.4 | 571.6 | 548.8 | 569.4 | 602.9 | 612.9 | 632.3 | 636.6 | 599.5 | 633.2 | 612.2 | 615.8 |
| 1997 | 605.6 | 635.0 | 644.7 | 592.9 | 579.0 | 574.0 | 591.0 | 594.6 | 561.4 | 568.7 | 574.0 | 596.4 |
| 1998 | 569.1 | 594.3 | 594.4 | 597.0 | 591.8 | 611.7 | 620.1 | 609.3 | 593.2 | 635.0 | 579.6 | 626.1 |
| 1999 | 512.1 | 565.8 | 589.9 | 590.1 | 567.1 | 628.0 | 646.6 | 613.8 | 614.5 | 597.5 | 606.0 | 647.0 |
| 2000 | 556.1 | 655.3 | 657.1 | 678.2 | 672.5 | 700.4 | 688.5 | 689.1 | 664.8 | 659.5 | 649.7 | 662.0 |
| 2001 | 652.9 | 690.7 | 690.1 | 639.7 | 665.8 | 659.9 | 742.7 | 840.9 | 759.7 | 790.4 | 753.3 | 749.9 |
| 2002 | 719.9 | 700.2 | 671.2 | 753.7 | 767.0 | 770.4 | 789.5 | 840.4 | 786.6 | 819.1 | 783.0 | 799.4 |
| 2003 | 776.5 | 809.3 | 766.9 | 850.4 | 903.5 | 825.1 | 882.6 | 846.1 | 870.1 | 836.7 | 817.0 | 804.5 |
| 2004 | 822.0 | 779.8 | 859.9 | 857.1 | 850.5 | 914.4 | 978.3 | 872.3 | 898.4 | 868.0 | 871.3 | 884.9 |
| 2005 | 828.0 | 873.0 | 858.6 | 867.1 | 862.6 | 899.9 | 922.5 | 994.4 | 958.1 | 964.0 | 907.6 | 1,004.9 |
| 2006 | 931.9 | 981.2 | 845.3 | NA | NA | 1,047.0 | 1,007.5 | 1,049.9 | 1,009.5 | 996.8 | 971.9 | 1,021.8 |
| 2007 | 920.1 | 950.0 | 960.4 | 969.3 | 961.4 | 991.2 | 994.0 | 1,018.9 | 962.3 | 965.7 | 912.5 | 988.7 |
| 2008 | 941.1 | 993.0 | 965.5 | 972.9 | 1,005.1 | 995.5 | 1,104.0 | 1,089.9 | 1,057.6 | 1,066.7 | 1,037.1 | 1,052.9 |
| 2009 | 1,010.1 | 1,061.4 | 1,045.3 | 1,030.6 | 1,058.2 | 1,076.9 | 1,054.1 | 1,054.4 | 1,027.4 | 1,031.9 | 985.8 | 1,020.5 |
| 2010 | 997.6 | 979.9 | 938.9 | 956.4 | 877.7 | 891.8 | 887.0 | 904.7 | 875.2 | 886.5 | 877.2 | 909.7 |
| 2011 | 895.4 | 945.1 | 931.5 | 947.6 | 920.1 | 938.6 | 953.9 | 965.6 | 953.2 | 933.5 | 926.9 | 937.9 |
| 2012 | 920.8 | 965.3 | 948.1 | 948.1 | 937.8 | 933.5 | 959.2 | 981.5 | 933.7 | 935.1 | 915.8 | 902.7 |
| 2013 | 920.1 | 948.8 | 910.4 | 940.3 | 932.8 | 909.1 | 945.1 | 943.3 | 840.8 | 977.1 | 962.8 | 950.2 |
| 2014 | 921.5 | 950.9 | 947.1 | 958.9 | 1,024.1 | 887.2 | 916.7 | 912.0 | 905.8 | 900.6 | 860.5 | 885.5 |
| 2015 | 928.3 | 967.1 | 958.0 | 967.8 | 955.3 | 967.1 | 972.8 | 1,002.9 | 964.4 | 949.4 | 947.8 | 973.4 |
| 2016 | 951.3 | 1,013.0 | 958.5 | 980.3 | 966.2 | 962.3 | 978.6 | 1,020.5 | 960.8 | 961.5 | 952.8 | 993.4 |
| 2017 | 927.0 | 955.0 | 978.1 | 962.9 | 986.5 | 970.2 | 966.8 | 994.6 | 1,065.6 | 1,040.5 | 972.3 | 949.8 |
| 2018 | 936.1 | 915.6 | 943.6 | 970.8 | 973.4 | 980.2 | 979.0 | 977.4 | 952.4 | 970.7 | 950.4 | 955.8 |
| 2019 | 944.5 | 955.5 | 961.1 | 964.2 | 983.4 | 984.0 | 996.0 | 1,018.1 | 974.0 | 965.4 | 951.5 | 957.3 |
| 2020 | 954.3 | 965.7 | 811.4 | 513.5 | 635.9 | 887.6 | 963.4 | 914.5 | 774.4 | 979.7 | 939.7 | 762.3 |
| 2021 | 772.3 | 811.8 | 817.3 | 914.2 | 932.6 | 968.7 | 943.6 | 958.3 | 899.3 | 973.9 | 930.0 | 931.2 |
| 2022 | 873.7 | 953.7 | 973.2 | |||||||||
| - = No Data Reported; -- = Not Applicable; NA = Not Available; W = Withheld to avoid disclosure of individual company data. |
| Release Date: 5/19/2022 |
| Next Release Date: TBD |