|
Download Data (XLS File) |
|
||||||||
|
||||||||
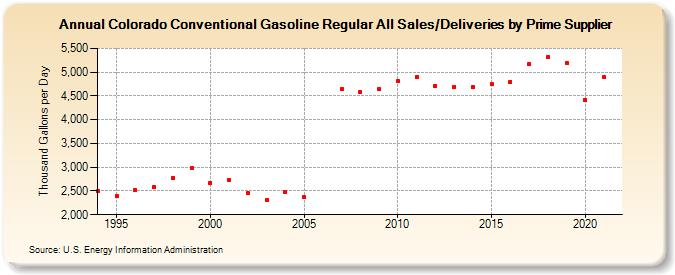
| Colorado Conventional Gasoline Regular All Sales/Deliveries by Prime Supplier (Thousand Gallons per Day) | ||||||||
| Decade | Year-0 | Year-1 | Year-2 | Year-3 | Year-4 | Year-5 | Year-6 | Year-7 | Year-8 | Year-9 |
|---|---|---|---|---|---|---|---|---|---|---|
| 1990's | 2,490.7 | 2,396.0 | 2,516.9 | 2,580.0 | 2,777.0 | 2,972.9 | ||||
| 2000's | 2,668.8 | 2,731.8 | 2,460.8 | 2,316.7 | 2,482.4 | 2,366.5 | W | 4,651.5 | 4,582.9 | 4,640.4 |
| 2010's | 4,818.5 | 4,901.0 | 4,711.7 | 4,697.8 | 4,686.1 | 4,742.9 | 4,801.4 | 5,167.5 | 5,321.4 | 5,186.2 |
| 2020's | 4,409.7 |
| - = No Data Reported; -- = Not Applicable; NA = Not Available; W = Withheld to avoid disclosure of individual company data. |
| Release Date: 6/1/2022 |
| Next Release Date: TBD |