|
Download Data (XLS File) |
|
||||||||
|
||||||||
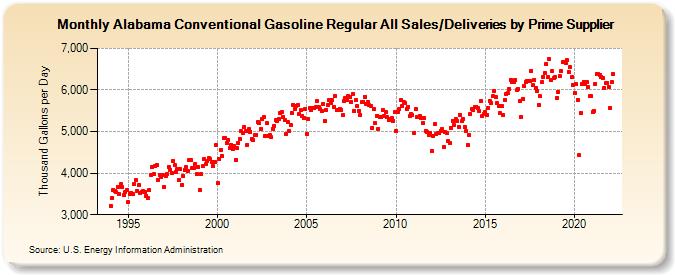
| Alabama Conventional Gasoline Regular All Sales/Deliveries by Prime Supplier (Thousand Gallons per Day) | ||||||||
| Year | Jan | Feb | Mar | Apr | May | Jun | Jul | Aug | Sep | Oct | Nov | Dec |
|---|---|---|---|---|---|---|---|---|---|---|---|---|
| 1993 | NA | NA | NA | |||||||||
| 1994 | 3,219.5 | 3,407.1 | 3,592.5 | 3,581.7 | 3,539.2 | 3,673.2 | 3,492.6 | 3,728.2 | 3,663.8 | 3,469.6 | 3,549.9 | 3,585.6 |
| 1995 | 3,303.0 | 3,496.8 | 3,531.0 | 3,489.5 | 3,740.3 | 3,837.7 | 3,576.9 | 3,720.9 | 3,514.0 | 3,553.7 | 3,568.4 | 3,546.0 |
| 1996 | 3,459.5 | 3,409.4 | 3,590.7 | 3,959.1 | 4,138.7 | 3,970.4 | 4,166.6 | 4,205.8 | 3,844.4 | 3,965.2 | 3,896.7 | 3,953.3 |
| 1997 | 3,667.7 | 3,926.1 | 3,969.0 | 4,148.3 | 4,080.6 | 4,004.1 | 4,286.9 | 4,184.6 | 4,035.4 | 4,094.3 | 3,845.6 | 4,097.2 |
| 1998 | 3,725.0 | 3,934.9 | 4,084.2 | 4,152.2 | 4,048.4 | 4,321.4 | 4,316.7 | 4,121.4 | 4,117.8 | 4,222.5 | 3,970.5 | 4,142.9 |
| 1999 | 3,588.5 | 3,974.2 | 4,162.8 | 4,338.7 | 4,213.4 | 4,303.2 | 4,368.6 | 4,343.1 | 4,278.7 | 4,166.3 | 4,279.2 | 4,688.4 |
| 2000 | 3,762.0 | 4,331.7 | 4,566.9 | 4,410.3 | 4,849.5 | 4,843.0 | 4,724.0 | 4,796.8 | 4,598.6 | 4,683.7 | 4,587.3 | 4,657.9 |
| 2001 | 4,326.9 | 4,601.1 | 4,729.6 | 4,824.8 | 5,007.1 | 4,955.6 | 5,107.5 | 5,016.1 | 4,683.1 | 5,056.2 | 4,989.9 | 4,832.8 |
| 2002 | 4,786.8 | 4,909.9 | 4,928.4 | 5,228.9 | 5,196.1 | 5,060.4 | 5,299.4 | 5,339.7 | 4,881.2 | 5,197.2 | 4,881.4 | 4,925.1 |
| 2003 | 4,860.0 | 5,068.0 | 5,136.6 | 5,280.7 | 5,252.7 | 5,297.5 | 5,437.7 | 5,466.1 | 5,360.5 | 5,278.2 | 4,938.0 | 5,234.1 |
| 2004 | 5,002.2 | 5,149.2 | 5,453.5 | 5,645.5 | 5,539.1 | 5,620.1 | 5,644.1 | 5,427.6 | 5,512.5 | 5,375.2 | 5,330.6 | 5,537.4 |
| 2005 | 4,950.0 | 5,303.1 | 5,560.5 | 5,511.3 | 5,562.7 | 5,571.1 | 5,584.5 | 5,728.0 | 5,583.5 | 5,538.9 | 5,482.3 | 5,670.6 |
| 2006 | 5,251.2 | 5,527.5 | 5,640.5 | 5,753.6 | 5,690.5 | 5,763.9 | 5,596.6 | 5,857.5 | 5,515.8 | 5,513.9 | 5,551.6 | 5,527.4 |
| 2007 | 5,394.9 | 5,727.4 | 5,814.3 | 5,758.2 | 5,857.5 | 5,820.4 | 5,714.5 | 5,910.0 | 5,497.8 | 5,746.8 | 5,607.9 | 5,502.4 |
| 2008 | 5,407.2 | 5,706.8 | 5,714.9 | 5,837.1 | 5,665.4 | 5,710.2 | 5,632.0 | 5,614.7 | 5,094.8 | 5,542.8 | 5,198.0 | 5,376.1 |
| 2009 | 5,070.8 | 5,361.4 | 5,340.1 | 5,518.7 | 5,364.1 | 5,471.5 | 5,340.8 | 5,269.0 | 5,291.8 | 5,314.7 | 5,258.9 | 5,471.4 |
| 2010 | 5,024.1 | 5,479.5 | 5,552.0 | 5,765.6 | 5,605.5 | 5,708.6 | 5,681.6 | 5,544.9 | 5,599.0 | 5,371.7 | 5,422.1 | 5,389.6 |
| 2011 | 4,968.9 | 5,543.9 | 5,357.7 | 5,354.6 | 5,362.6 | 5,314.0 | 5,216.5 | 5,324.0 | 5,021.1 | 4,986.9 | 4,926.8 | 4,955.3 |
| 2012 | 4,530.1 | 4,903.1 | 5,171.4 | 4,949.9 | 4,968.4 | 4,961.4 | 5,020.3 | 5,060.5 | 4,631.2 | 5,000.0 | 4,962.1 | 4,763.1 |
| 2013 | 4,720.4 | 5,090.6 | 5,261.6 | 5,151.1 | 5,303.5 | 5,247.3 | 5,112.6 | 5,409.9 | 5,246.5 | 5,307.9 | 5,111.3 | 5,019.0 |
| 2014 | 4,678.3 | 4,922.4 | 5,418.4 | 5,535.1 | 5,508.3 | 5,595.1 | 5,600.8 | 5,565.9 | 5,485.7 | 5,736.9 | 5,379.7 | 5,416.9 |
| 2015 | 5,472.7 | 5,409.3 | 5,561.6 | 5,743.0 | 5,689.6 | 5,844.7 | 5,973.5 | 5,830.6 | 5,675.1 | 5,618.8 | 5,436.6 | 5,619.6 |
| 2016 | 5,391.7 | 5,770.4 | 5,900.6 | 5,931.6 | 6,027.6 | 6,251.2 | 6,199.3 | 6,196.0 | 6,242.5 | 5,988.4 | 6,033.2 | 5,723.1 |
| 2017 | 5,345.5 | 5,789.2 | 6,085.4 | 6,194.6 | 6,225.9 | 6,224.5 | 6,218.1 | 6,463.8 | 6,111.8 | 6,245.4 | 6,057.5 | 5,968.5 |
| 2018 | 5,650.4 | 5,847.9 | 6,184.5 | 6,318.1 | 6,409.2 | 6,622.0 | 6,309.0 | 6,745.2 | 6,251.5 | 6,455.3 | 6,290.5 | 6,308.5 |
| 2019 | 5,814.4 | 5,954.5 | 6,330.5 | 6,447.3 | 6,669.2 | 6,681.1 | 6,654.4 | 6,713.1 | 6,432.7 | 6,543.1 | 6,310.3 | 6,131.0 |
| 2020 | 5,923.5 | 6,135.1 | 5,769.4 | 4,425.5 | 5,446.7 | 6,141.5 | 6,203.3 | 6,153.5 | 6,186.8 | 6,060.7 | 5,854.9 | 5,849.7 |
| 2021 | 5,465.2 | 5,501.6 | 6,155.6 | 6,384.5 | 6,382.8 | 6,361.9 | 6,318.5 | 6,281.5 | 6,048.9 | 6,156.1 | 6,171.6 | 6,075.8 |
| 2022 | 5,568.9 | 6,195.9 | 6,383.9 | |||||||||
| - = No Data Reported; -- = Not Applicable; NA = Not Available; W = Withheld to avoid disclosure of individual company data. |
| Release Date: 5/19/2022 |
| Next Release Date: TBD |