|
Download Data (XLS File) |
|
||||||||
|
||||||||
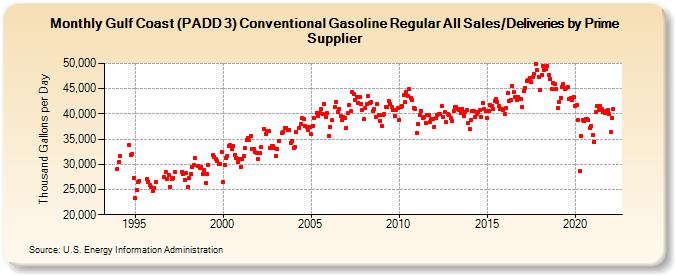
| Gulf Coast (PADD 3) Conventional Gasoline Regular All Sales/Deliveries by Prime Supplier (Thousand Gallons per Day) | ||||||||
| Year | Jan | Feb | Mar | Apr | May | Jun | Jul | Aug | Sep | Oct | Nov | Dec |
|---|---|---|---|---|---|---|---|---|---|---|---|---|
| 1993 | NA | NA | NA | |||||||||
| 1994 | 29,048.4 | 30,461.6 | 31,581.6 | W | W | W | W | W | 33,825.9 | 31,867.6 | 32,102.5 | 27,279.5 |
| 1995 | 23,288.5 | 24,944.8 | 26,435.9 | 26,615.3 | W | W | W | W | 26,991.3 | 26,540.6 | 25,816.2 | 25,444.7 |
| 1996 | 24,641.7 | 25,374.5 | 26,578.7 | W | W | W | W | W | 27,495.1 | 28,527.4 | 27,111.8 | 27,791.1 |
| 1997 | 25,572.4 | 27,135.8 | 27,265.8 | 28,406.4 | W | W | W | W | 28,530.7 | 28,141.8 | 26,931.9 | 28,235.3 |
| 1998 | 25,538.8 | 27,212.7 | 28,030.2 | 29,442.1 | 29,901.7 | 31,179.2 | W | 29,669.5 | 29,287.8 | 29,440.8 | 28,117.6 | 28,905.3 |
| 1999 | 26,348.0 | 28,122.8 | 29,917.3 | W | W | 31,757.7 | 31,460.3 | 30,975.1 | 30,624.4 | 30,000.7 | 30,087.3 | 32,472.1 |
| 2000 | 26,402.2 | 29,889.4 | 31,311.0 | 31,744.3 | 33,557.7 | 33,763.3 | 32,984.7 | 33,644.7 | 31,932.2 | 31,240.3 | 30,485.0 | 31,116.4 |
| 2001 | 29,547.1 | 31,144.6 | 31,632.6 | 33,214.1 | 34,836.2 | 35,295.4 | 34,768.0 | 35,546.4 | 32,958.0 | 33,079.5 | 32,398.6 | 32,228.8 |
| 2002 | 31,112.4 | 32,324.5 | 33,404.5 | W | 37,072.9 | 36,066.7 | 36,556.5 | 36,507.6 | 33,306.4 | 33,696.9 | 33,651.1 | 33,141.0 |
| 2003 | 31,711.7 | 32,975.1 | 34,591.0 | W | 36,128.3 | 36,407.5 | 37,269.9 | 37,287.7 | 36,766.7 | 36,815.9 | 34,256.6 | 34,670.0 |
| 2004 | 33,299.2 | 33,427.3 | 36,414.6 | W | 37,268.1 | 37,906.3 | 39,139.9 | 39,030.1 | 37,554.4 | 37,308.6 | 36,807.4 | 37,460.8 |
| 2005 | 35,917.9 | 37,631.3 | 39,171.7 | W | 40,233.1 | 39,623.3 | 40,177.2 | 40,875.4 | 39,940.8 | 41,967.0 | 39,421.5 | 40,113.8 |
| 2006 | 35,652.0 | 37,437.0 | 38,736.2 | W | 41,358.1 | 42,377.9 | 40,419.5 | 40,948.5 | 39,668.3 | 38,769.7 | 39,434.6 | 39,220.5 |
| 2007 | 37,295.5 | 40,161.4 | 41,735.6 | 40,479.0 | 44,314.2 | 43,956.3 | 42,832.2 | 43,382.1 | 42,201.7 | 43,344.0 | 41,957.7 | 40,812.3 |
| 2008 | 38,907.3 | 41,085.3 | 41,885.7 | 43,537.3 | 42,218.8 | 42,317.3 | 40,535.0 | 40,972.1 | 39,467.6 | 41,992.0 | 39,752.3 | 38,614.2 |
| 2009 | 37,627.9 | 39,685.2 | 40,064.0 | 41,304.0 | 41,340.2 | 42,478.8 | 41,974.2 | 41,342.6 | 40,730.2 | 39,602.3 | 40,683.0 | 41,169.5 |
| 2010 | 38,828.1 | 41,335.6 | 41,662.0 | 43,727.2 | 42,340.3 | 44,295.6 | 43,559.0 | 45,024.7 | 43,143.5 | 42,844.2 | 41,255.2 | 40,975.3 |
| 2011 | 36,256.5 | 38,026.3 | 39,755.2 | 40,655.7 | 39,193.4 | 39,331.2 | 38,202.5 | 39,853.5 | 39,703.6 | 38,463.8 | 38,902.9 | 39,063.8 |
| 2012 | 37,447.4 | 39,148.9 | 39,855.3 | 40,044.8 | 39,987.5 | 41,516.2 | 39,401.5 | 40,338.3 | 38,300.5 | 39,902.0 | 39,795.1 | 39,146.4 |
| 2013 | 38,649.2 | 40,646.7 | 41,363.4 | 41,344.2 | 41,039.2 | 40,734.4 | 40,196.1 | 40,998.1 | 39,631.9 | 40,469.6 | 40,803.5 | 38,124.7 |
| 2014 | 37,063.9 | 38,780.1 | 40,496.1 | 40,507.6 | 39,464.3 | 40,008.4 | 40,347.4 | 40,681.3 | 39,377.9 | 42,226.3 | 40,982.6 | 40,614.6 |
| 2015 | 39,190.6 | 40,615.4 | 41,842.6 | 41,479.0 | 41,062.8 | 42,644.1 | 42,986.9 | 42,371.1 | 41,477.4 | 41,056.2 | 40,968.1 | 40,675.8 |
| 2016 | 39,963.1 | 41,191.7 | 44,157.2 | 42,638.3 | 42,796.7 | 45,587.6 | 44,390.0 | 43,258.3 | 42,750.9 | 43,406.4 | 42,938.0 | 42,944.6 |
| 2017 | 41,349.1 | 44,510.9 | 45,177.9 | 46,531.8 | 46,662.2 | 47,158.6 | 46,278.5 | 47,257.3 | 47,815.1 | 49,861.5 | 48,630.3 | 47,381.4 |
| 2018 | 44,829.0 | 47,801.3 | 49,587.7 | 48,745.5 | 48,833.1 | 49,594.8 | 47,737.8 | 46,856.8 | 45,003.6 | 46,195.0 | 45,862.3 | 44,898.5 |
| 2019 | 41,263.3 | 42,426.0 | 43,247.3 | 45,311.3 | 45,880.4 | 44,901.6 | 45,162.3 | 45,270.5 | 42,975.9 | 43,081.1 | 42,704.0 | 43,345.6 |
| 2020 | 41,622.2 | 41,849.9 | 38,694.4 | 28,628.9 | 35,626.7 | 38,861.0 | 38,582.1 | 38,908.0 | 38,904.3 | 38,742.3 | 37,276.1 | 37,654.4 |
| 2021 | 35,907.6 | 34,430.0 | 40,333.0 | 41,570.6 | 40,714.2 | 41,554.7 | 40,873.2 | 40,388.1 | 40,096.0 | 40,642.3 | 40,786.9 | 40,056.2 |
| 2022 | 36,449.8 | 39,271.3 | 40,884.5 | |||||||||
| - = No Data Reported; -- = Not Applicable; NA = Not Available; W = Withheld to avoid disclosure of individual company data. |
| Release Date: 5/19/2022 |
| Next Release Date: TBD |