|
Download Data (XLS File) |
|
||||||||
|
||||||||
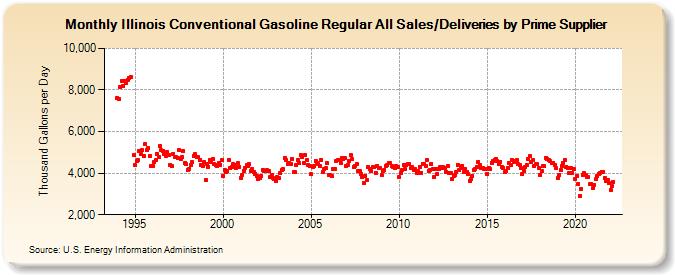
| Illinois Conventional Gasoline Regular All Sales/Deliveries by Prime Supplier (Thousand Gallons per Day) | ||||||||
| Year | Jan | Feb | Mar | Apr | May | Jun | Jul | Aug | Sep | Oct | Nov | Dec |
|---|---|---|---|---|---|---|---|---|---|---|---|---|
| 1993 | NA | NA | NA | |||||||||
| 1994 | 7,623.3 | 7,554.9 | 8,140.1 | 8,451.1 | 8,175.2 | 8,435.6 | 8,349.8 | 8,480.4 | 8,592.9 | 8,611.6 | W | 4,851.2 |
| 1995 | 4,382.9 | 4,604.6 | 4,620.9 | 5,069.1 | 4,899.5 | 5,113.2 | 4,838.5 | 5,393.1 | 5,094.8 | 5,215.4 | 4,816.0 | 4,359.5 |
| 1996 | 4,360.8 | 4,529.3 | 4,620.6 | 4,938.6 | 4,798.2 | 5,312.8 | 5,096.1 | 5,076.8 | 4,940.4 | 4,800.3 | 5,007.3 | 4,850.3 |
| 1997 | 4,399.1 | 4,319.8 | 4,940.7 | 4,779.6 | 4,782.1 | 4,706.6 | 5,135.7 | 4,669.4 | 4,768.8 | 5,054.2 | 4,493.4 | 4,418.6 |
| 1998 | 4,166.9 | 4,217.2 | 4,407.0 | 4,532.9 | 4,824.6 | 4,916.6 | 4,769.3 | 4,759.3 | 4,654.5 | 4,404.5 | 4,337.1 | 4,526.5 |
| 1999 | 3,690.7 | 4,452.9 | 4,317.0 | 4,645.6 | 4,513.4 | 4,668.7 | 4,433.4 | 4,370.8 | 4,353.7 | 4,485.5 | 4,405.6 | 4,619.0 |
| 2000 | 3,855.9 | 4,168.6 | 4,038.3 | 4,088.5 | 4,649.4 | 4,246.7 | 4,313.2 | 4,437.9 | 4,368.6 | 4,254.5 | 4,483.5 | 4,306.7 |
| 2001 | 3,775.9 | 3,932.2 | 4,123.5 | 4,249.7 | 4,373.3 | 4,319.9 | 4,423.4 | 4,119.6 | 4,181.6 | 4,043.7 | 3,963.2 | 3,838.1 |
| 2002 | 3,719.1 | 3,742.0 | 3,840.7 | 4,170.5 | 4,101.3 | 4,125.0 | 4,126.7 | 4,083.4 | 3,800.1 | 3,904.7 | 3,750.3 | 3,738.6 |
| 2003 | 3,627.9 | 3,792.4 | 3,763.1 | 4,008.0 | 4,159.9 | 4,186.0 | 4,744.1 | 4,632.7 | 4,441.1 | 4,509.6 | 4,421.6 | 4,684.2 |
| 2004 | 4,044.0 | 4,031.8 | 4,374.7 | 4,628.8 | 4,471.6 | 4,871.3 | 4,757.7 | 4,492.5 | 4,862.3 | 4,626.1 | 4,406.6 | 4,364.1 |
| 2005 | 3,942.2 | 4,313.5 | 4,347.4 | 4,593.5 | 4,499.5 | 4,432.4 | 4,339.2 | 4,641.7 | 4,072.8 | 4,189.0 | 4,225.8 | 4,466.4 |
| 2006 | 3,913.3 | 3,904.0 | 3,871.9 | 4,194.1 | 4,206.5 | 4,576.9 | 4,611.1 | 4,655.3 | 4,480.0 | 4,724.2 | 4,665.7 | 4,710.8 |
| 2007 | 4,319.1 | 4,404.7 | 4,598.3 | 4,860.4 | 4,675.9 | 4,303.9 | 4,350.0 | 4,432.7 | 4,093.8 | 4,120.4 | 3,975.0 | 3,791.5 |
| 2008 | 3,548.1 | 3,874.1 | 3,647.6 | 4,311.8 | 4,201.3 | 4,100.9 | 4,292.9 | 4,294.2 | 4,026.7 | 4,363.8 | 4,266.4 | 4,246.4 |
| 2009 | 3,913.9 | 4,088.3 | 4,174.1 | 4,337.2 | 4,400.0 | 4,484.2 | 4,471.8 | 4,346.8 | 4,274.8 | 4,251.2 | 4,352.3 | 4,310.1 |
| 2010 | 3,803.0 | 4,022.3 | 4,138.8 | 4,381.0 | 4,204.5 | 4,370.3 | 4,436.2 | 4,447.5 | 4,244.3 | 4,272.9 | 4,158.7 | 4,198.2 |
| 2011 | 4,012.3 | 4,092.8 | 4,295.0 | 4,020.7 | 4,463.2 | 4,432.9 | 4,363.0 | 4,617.9 | 4,101.6 | 4,174.1 | 4,457.0 | 4,190.9 |
| 2012 | 3,817.6 | 4,188.4 | 3,949.4 | 4,200.3 | 4,278.6 | 4,253.4 | 4,273.3 | 4,235.2 | 4,078.5 | 4,335.0 | 4,008.6 | 3,990.1 |
| 2013 | 3,716.0 | 3,873.1 | 3,895.7 | 4,077.6 | 4,414.8 | 4,147.5 | 4,224.1 | 4,355.5 | 4,050.4 | 4,209.3 | 4,077.4 | 3,960.2 |
| 2014 | 3,635.4 | 3,726.8 | 3,869.5 | 4,156.3 | 4,202.4 | 4,296.9 | 4,551.9 | 4,397.0 | 4,243.6 | 4,231.0 | 4,210.0 | 4,197.5 |
| 2015 | 3,978.2 | 4,261.7 | 4,192.9 | 4,501.9 | 4,561.9 | 4,646.5 | 4,680.9 | 4,581.2 | 4,459.4 | 4,547.9 | 4,317.9 | 4,255.1 |
| 2016 | 4,039.8 | 4,105.2 | 4,259.5 | 4,473.8 | 4,378.0 | 4,628.5 | 4,545.5 | 4,604.4 | 4,626.1 | 4,425.6 | 4,378.3 | 4,263.2 |
| 2017 | 3,940.5 | 4,116.9 | 4,300.8 | 4,369.9 | 4,675.2 | 4,820.4 | 4,534.2 | 4,629.8 | 4,348.6 | 4,418.6 | 4,416.6 | 4,269.5 |
| 2018 | 3,910.2 | 4,108.3 | 4,339.5 | 4,326.2 | 4,741.0 | 4,681.8 | 4,625.6 | 4,562.5 | 4,477.1 | 4,504.4 | 4,382.4 | 4,227.4 |
| 2019 | 3,758.5 | 3,917.1 | 4,155.9 | 4,361.6 | 4,509.6 | 4,636.1 | 4,313.0 | 4,262.8 | 4,029.7 | 4,229.5 | 4,022.0 | 4,183.4 |
| 2020 | 3,732.2 | 3,857.0 | 3,498.5 | 2,908.9 | 3,249.5 | 3,894.6 | 4,004.0 | 3,911.1 | 3,822.2 | 3,792.3 | 3,457.3 | 3,487.2 |
| 2021 | 3,264.9 | 3,437.8 | 3,698.2 | 3,865.2 | 3,946.5 | 4,008.9 | 4,069.9 | 4,053.5 | 3,784.5 | 3,641.9 | 3,650.8 | 3,512.2 |
| 2022 | 3,209.5 | 3,365.1 | 3,576.3 | |||||||||
| - = No Data Reported; -- = Not Applicable; NA = Not Available; W = Withheld to avoid disclosure of individual company data. |
| Release Date: 5/19/2022 |
| Next Release Date: TBD |