|
Download Data (XLS File) |
|
||||||||
|
||||||||
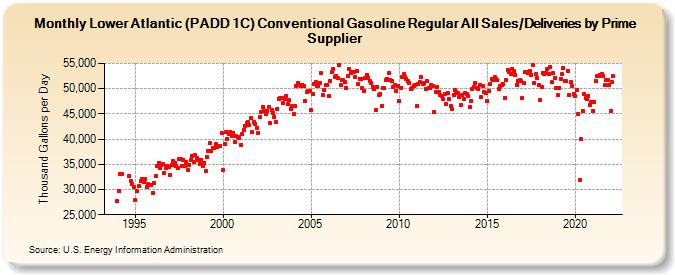
| Lower Atlantic (PADD 1C) Conventional Gasoline Regular All Sales/Deliveries by Prime Supplier (Thousand Gallons per Day) | ||||||||
| Year | Jan | Feb | Mar | Apr | May | Jun | Jul | Aug | Sep | Oct | Nov | Dec |
|---|---|---|---|---|---|---|---|---|---|---|---|---|
| 1993 | NA | NA | NA | |||||||||
| 1994 | 27,632.0 | 29,607.6 | 33,138.0 | 33,136.9 | W | W | W | W | 32,677.8 | 31,769.7 | 31,089.1 | 30,445.7 |
| 1995 | 27,895.0 | 29,674.9 | W | 30,641.5 | 31,620.9 | 31,997.7 | 31,484.2 | 32,030.2 | 30,418.8 | 30,999.1 | W | 30,853.0 |
| 1996 | 29,263.9 | 31,309.8 | 32,733.6 | 34,728.2 | 35,307.9 | 34,313.9 | 34,804.3 | 35,033.9 | 33,187.7 | 34,299.1 | 34,747.5 | 34,422.9 |
| 1997 | 32,881.5 | 34,798.8 | 35,592.9 | 35,351.4 | 34,604.0 | 34,337.9 | 36,078.7 | 36,045.4 | 34,724.4 | 35,873.5 | 34,734.6 | 35,473.8 |
| 1998 | 33,782.2 | 34,921.6 | 35,853.2 | 36,650.8 | 35,544.1 | 36,793.2 | 36,253.1 | 35,786.2 | 35,141.5 | 35,929.3 | 34,648.1 | 35,350.7 |
| 1999 | 33,710.2 | 36,474.6 | 37,546.5 | 39,148.5 | 37,585.0 | 38,203.5 | 38,250.3 | 38,993.7 | 38,407.3 | 38,617.0 | 38,556.5 | 41,231.8 |
| 2000 | 33,784.3 | 39,008.1 | 41,375.5 | 40,026.6 | 40,945.5 | 41,467.2 | 40,630.6 | 41,226.2 | 39,419.1 | 40,536.3 | 40,373.4 | 40,234.1 |
| 2001 | 38,886.5 | 40,917.0 | 41,850.4 | 42,690.0 | 43,228.4 | 43,343.9 | 42,753.5 | 44,126.6 | 41,344.8 | 43,394.1 | 42,906.5 | 42,254.6 |
| 2002 | 41,185.4 | 44,319.5 | 45,454.8 | 46,453.0 | 45,596.8 | 44,965.6 | 45,491.5 | 46,436.4 | 43,229.2 | 45,866.9 | 45,086.4 | 44,437.0 |
| 2003 | 43,319.5 | 46,033.0 | 48,048.9 | 48,212.6 | 48,147.1 | 47,136.7 | 48,039.9 | 48,607.6 | 46,893.5 | 47,684.1 | 45,998.1 | 46,576.5 |
| 2004 | 44,989.4 | 46,597.9 | 50,464.2 | 51,222.1 | 50,700.7 | 50,532.3 | 50,821.3 | 50,478.5 | 47,509.8 | 49,375.7 | 49,512.5 | 49,518.7 |
| 2005 | 45,682.9 | 48,945.3 | 51,008.0 | 51,233.2 | 50,469.8 | 50,593.0 | 51,133.2 | 53,048.0 | 48,685.8 | 49,733.9 | 50,701.4 | 50,730.2 |
| 2006 | 48,634.7 | 51,584.6 | 53,390.0 | 53,913.6 | 52,295.4 | 52,521.9 | 52,158.2 | 54,625.4 | 50,674.2 | 51,691.3 | 51,697.5 | 51,253.5 |
| 2007 | 50,207.7 | 52,461.6 | 53,934.7 | 53,128.0 | 53,270.3 | 53,286.4 | 52,346.5 | 53,567.2 | 50,903.6 | 51,845.0 | 51,862.1 | 50,045.7 |
| 2008 | 49,603.1 | 52,190.3 | 52,811.5 | 52,079.4 | 51,602.7 | 51,144.3 | 50,414.4 | 49,881.1 | 45,710.5 | 50,339.3 | 48,662.3 | 48,951.0 |
| 2009 | 46,605.6 | 50,183.5 | 50,100.4 | 51,640.1 | 52,017.0 | 53,065.2 | 51,709.0 | 51,473.5 | 50,277.8 | 50,676.0 | 49,638.9 | 50,479.2 |
| 2010 | 47,539.5 | 50,120.4 | 52,251.6 | 52,867.8 | 52,222.0 | 51,880.1 | 51,619.9 | 51,142.6 | 49,923.7 | 50,232.2 | 50,476.3 | 50,741.1 |
| 2011 | 46,613.8 | 50,953.2 | 51,327.8 | 52,299.0 | 50,989.0 | 51,172.2 | 49,878.5 | 51,460.5 | 50,199.5 | 50,076.6 | 50,736.4 | 50,445.4 |
| 2012 | 45,312.3 | 49,298.9 | 50,359.2 | 49,441.1 | 48,679.3 | 48,615.5 | 47,918.7 | 48,915.3 | 46,983.0 | 49,170.5 | 47,891.9 | 46,498.1 |
| 2013 | 45,993.2 | 48,845.0 | 49,829.9 | 49,278.7 | 49,089.6 | 48,349.4 | 46,797.8 | 48,663.9 | 47,906.4 | 49,063.1 | 48,892.1 | 48,516.4 |
| 2014 | 46,270.3 | 47,625.9 | 49,944.1 | 50,430.5 | 51,178.4 | 50,174.1 | 50,009.4 | 50,662.6 | 48,320.8 | 50,578.3 | 49,352.5 | 49,226.4 |
| 2015 | 47,541.9 | 49,515.3 | 51,027.0 | 51,887.1 | 51,649.1 | 52,328.3 | 51,844.4 | 51,652.1 | 49,893.2 | 50,602.5 | 50,781.9 | 50,851.5 |
| 2016 | 48,227.5 | 51,763.4 | 53,805.1 | 53,261.2 | 52,873.5 | 53,914.0 | 53,429.1 | 52,738.5 | 50,829.8 | 51,623.5 | 51,636.7 | 51,456.3 |
| 2017 | 48,119.7 | 51,072.6 | 53,270.5 | 53,329.0 | 53,042.8 | 53,443.3 | 52,748.1 | 54,722.2 | 51,166.9 | 52,816.4 | 52,028.0 | 50,654.2 |
| 2018 | 47,790.9 | 50,346.3 | 53,198.2 | 52,908.1 | 53,091.9 | 53,880.3 | 52,832.5 | 54,268.0 | 51,236.0 | 53,204.4 | 52,084.6 | 50,189.9 |
| 2019 | 48,652.5 | 50,125.9 | 52,020.0 | 52,872.1 | 54,118.5 | 51,596.4 | 51,496.3 | 53,475.0 | 48,705.8 | 51,295.8 | 50,564.5 | 49,033.8 |
| 2020 | 48,480.8 | 49,824.4 | 44,997.9 | 31,975.5 | 39,951.8 | 45,545.2 | 48,950.2 | 48,100.8 | 48,019.6 | 48,646.4 | 46,810.8 | 47,269.8 |
| 2021 | 45,536.8 | 47,381.2 | 51,615.7 | 52,607.9 | 52,423.0 | 52,748.4 | 52,898.0 | 52,556.6 | 50,752.2 | 51,798.6 | 51,652.9 | 50,653.3 |
| 2022 | 45,648.7 | 51,324.0 | 52,505.8 | |||||||||
| - = No Data Reported; -- = Not Applicable; NA = Not Available; W = Withheld to avoid disclosure of individual company data. |
| Release Date: 5/19/2022 |
| Next Release Date: TBD |