|
Download Data (XLS File) |
|
||||||||
|
||||||||
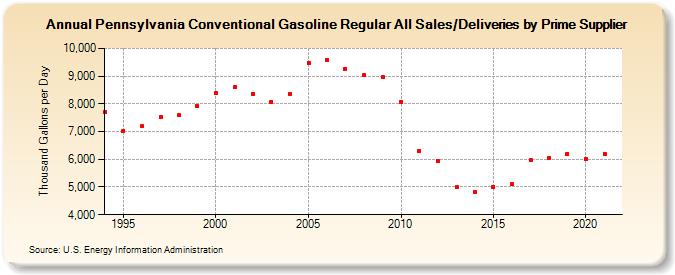
| Pennsylvania Conventional Gasoline Regular All Sales/Deliveries by Prime Supplier (Thousand Gallons per Day) | ||||||||
| Decade | Year-0 | Year-1 | Year-2 | Year-3 | Year-4 | Year-5 | Year-6 | Year-7 | Year-8 | Year-9 |
|---|---|---|---|---|---|---|---|---|---|---|
| 1990's | 7,704.8 | 7,032.7 | 7,182.6 | 7,521.4 | 7,591.1 | 7,914.8 | ||||
| 2000's | 8,398.9 | 8,597.1 | 8,372.3 | 8,081.5 | 8,364.9 | 9,488.1 | 9,586.4 | 9,270.7 | 9,026.5 | 8,958.4 |
| 2010's | 8,069.5 | 6,310.7 | 5,954.4 | 5,008.3 | 4,828.7 | 5,009.8 | 5,093.8 | 5,964.0 | 6,063.1 | 6,207.3 |
| 2020's | 6,009.6 |
| - = No Data Reported; -- = Not Applicable; NA = Not Available; W = Withheld to avoid disclosure of individual company data. |
| Release Date: 6/1/2022 |
| Next Release Date: TBD |