|
Download Data (XLS File) |
|
||||||||
|
||||||||
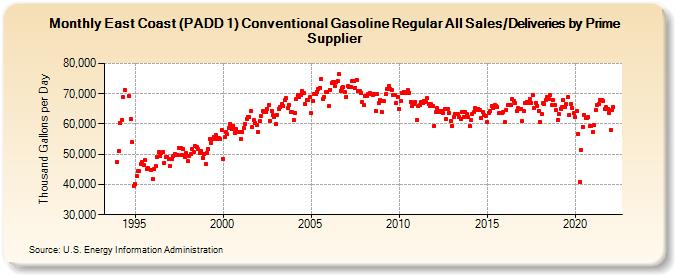
| East Coast (PADD 1) Conventional Gasoline Regular All Sales/Deliveries by Prime Supplier (Thousand Gallons per Day) | ||||||||
| Year | Jan | Feb | Mar | Apr | May | Jun | Jul | Aug | Sep | Oct | Nov | Dec |
|---|---|---|---|---|---|---|---|---|---|---|---|---|
| 1993 | NA | NA | NA | |||||||||
| 1994 | 47,507.7 | 51,066.8 | 60,255.1 | 61,341.7 | 68,836.7 | 71,376.6 | W | W | 69,092.3 | 61,634.3 | 53,880.6 | 39,528.3 |
| 1995 | 40,165.9 | 42,696.8 | 44,378.7 | 44,323.4 | 46,610.8 | 47,478.4 | 46,559.9 | 47,973.8 | 45,005.4 | 45,369.3 | W | 44,747.3 |
| 1996 | 41,721.6 | 45,035.0 | 46,048.8 | 49,147.0 | 50,592.7 | 49,258.9 | 50,333.2 | 50,792.6 | 47,211.1 | 49,174.0 | 49,016.8 | 48,336.3 |
| 1997 | 46,221.2 | 48,440.1 | 49,293.3 | 50,134.0 | 49,834.2 | 49,641.8 | 52,022.9 | 52,000.0 | 49,625.0 | 51,640.6 | 49,222.3 | 50,397.8 |
| 1998 | 47,610.9 | 49,532.8 | 50,165.0 | 51,616.4 | 50,866.5 | 52,568.5 | 52,417.1 | 51,622.3 | 50,409.0 | 51,070.8 | 48,814.9 | 50,225.1 |
| 1999 | 46,632.3 | 50,498.5 | 51,870.1 | 55,033.2 | 53,819.7 | 55,074.9 | 55,661.4 | 56,250.4 | 55,157.1 | 55,230.6 | 54,987.4 | 58,139.9 |
| 2000 | 48,364.6 | 55,533.1 | 57,294.0 | 56,563.9 | 58,678.9 | 60,079.0 | 58,301.7 | 59,376.0 | 57,075.9 | 58,271.3 | 57,295.8 | 57,488.7 |
| 2001 | 55,027.6 | 57,236.3 | 58,574.9 | 60,037.6 | 61,491.6 | 62,291.3 | 62,195.1 | 64,144.5 | 58,862.6 | 61,167.5 | 60,313.5 | 59,591.1 |
| 2002 | 57,301.3 | 60,887.0 | 62,604.5 | 64,155.0 | 64,104.4 | 64,035.0 | 64,962.4 | 66,354.8 | 61,097.9 | 64,226.4 | 62,866.1 | 62,442.5 |
| 2003 | 59,859.7 | 63,105.7 | 65,098.1 | 65,759.6 | 66,523.4 | 66,006.7 | 67,776.1 | 68,476.5 | 65,117.3 | 66,329.7 | 63,855.1 | 63,987.5 |
| 2004 | 61,460.1 | 63,786.2 | 68,259.1 | 69,734.1 | 69,050.4 | 69,530.5 | 70,863.0 | 70,089.9 | 66,448.2 | 67,808.5 | 67,904.4 | 68,839.3 |
| 2005 | 63,482.0 | 67,583.3 | 69,895.2 | 69,838.6 | 70,642.6 | 71,692.4 | 72,008.7 | 74,909.7 | 68,178.6 | 69,020.6 | 70,635.6 | 70,541.2 |
| 2006 | 65,941.9 | 71,351.3 | 73,432.4 | 73,852.6 | 72,542.2 | 73,914.4 | 74,237.9 | 76,605.2 | 71,020.0 | 71,970.6 | 72,284.0 | 70,647.2 |
| 2007 | 68,968.8 | 72,438.1 | 72,372.4 | 72,368.5 | 74,180.8 | 74,276.2 | 72,042.7 | 74,688.4 | 70,741.2 | 70,929.8 | 70,212.5 | 67,106.7 |
| 2008 | 66,133.9 | 69,259.1 | 69,351.0 | 69,847.0 | 70,111.0 | 69,996.4 | 69,501.0 | 69,821.7 | 64,325.2 | 69,916.9 | 66,899.6 | 68,066.8 |
| 2009 | 64,102.9 | 67,661.1 | 67,461.9 | 69,846.0 | 71,587.6 | 72,528.7 | 71,584.6 | 71,157.9 | 69,430.8 | 69,496.6 | 66,918.9 | 68,999.0 |
| 2010 | 64,894.4 | 67,532.3 | 70,080.4 | 70,663.3 | 70,384.5 | 70,317.6 | 71,088.2 | 70,272.1 | 67,358.7 | 65,951.8 | 66,693.5 | 67,297.6 |
| 2011 | 61,322.6 | 65,993.0 | 66,238.1 | 67,231.0 | 66,811.2 | 67,663.2 | 67,155.0 | 68,471.2 | 66,531.4 | 66,065.0 | 66,441.5 | 65,894.6 |
| 2012 | 59,285.6 | 63,866.2 | 65,129.4 | 64,199.0 | 63,868.6 | 64,405.0 | 63,642.9 | 65,015.0 | 61,620.0 | 64,875.9 | 63,767.3 | 60,981.2 |
| 2013 | 59,347.5 | 62,389.4 | 63,170.8 | 63,420.7 | 63,378.3 | 62,468.0 | 61,552.2 | 63,913.6 | 62,419.6 | 63,819.2 | 63,166.9 | 62,222.4 |
| 2014 | 59,224.0 | 61,402.3 | 63,313.4 | 63,798.1 | 65,292.3 | 64,480.2 | 64,971.7 | 64,639.6 | 61,971.3 | 64,001.4 | 63,039.5 | 62,760.4 |
| 2015 | 60,562.4 | 63,753.5 | 64,201.7 | 65,888.3 | 65,125.1 | 66,255.3 | 66,070.0 | 65,476.9 | 63,497.8 | 63,621.6 | 63,731.8 | 63,894.2 |
| 2016 | 60,520.8 | 64,748.9 | 66,180.4 | 66,244.6 | 66,165.1 | 68,247.8 | 67,727.2 | 66,921.2 | 64,337.9 | 65,128.4 | 65,018.5 | 65,012.2 |
| 2017 | 60,890.6 | 64,132.0 | 66,880.2 | 67,357.0 | 67,046.7 | 68,188.3 | 67,024.8 | 69,625.8 | 65,435.1 | 66,948.2 | 66,069.1 | 64,380.6 |
| 2018 | 60,595.9 | 63,286.4 | 66,868.4 | 66,494.8 | 67,938.8 | 69,024.4 | 68,116.3 | 69,641.2 | 66,113.7 | 68,055.4 | 66,397.8 | 64,469.9 |
| 2019 | 61,451.1 | 63,135.1 | 65,044.9 | 65,482.2 | 67,933.9 | 65,635.7 | 66,484.5 | 68,929.3 | 63,048.2 | 66,613.1 | 65,250.5 | 63,644.6 |
| 2020 | 62,185.1 | 64,204.7 | 56,835.5 | 40,738.5 | 51,248.2 | 58,948.2 | 63,030.6 | 62,045.9 | 61,897.2 | 62,302.4 | 59,195.6 | 59,368.9 |
| 2021 | 57,367.0 | 59,504.0 | 64,729.9 | 66,109.3 | 66,638.3 | 67,901.8 | 68,091.5 | 67,698.8 | 64,857.5 | 65,572.1 | 65,060.0 | 63,749.5 |
| 2022 | 58,113.6 | 64,681.7 | 65,686.3 | |||||||||
| - = No Data Reported; -- = Not Applicable; NA = Not Available; W = Withheld to avoid disclosure of individual company data. |
| Release Date: 5/19/2022 |
| Next Release Date: TBD |