|
Download Data (XLS File) |
|
||||||||
|
||||||||
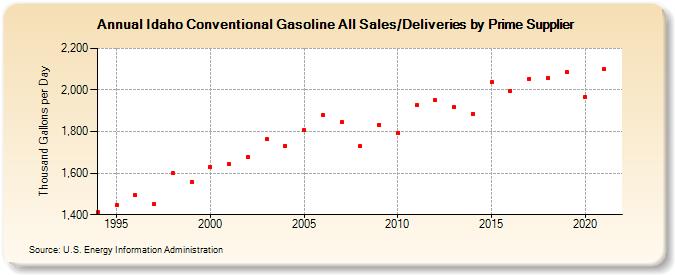
| Idaho Conventional Gasoline All Sales/Deliveries by Prime Supplier (Thousand Gallons per Day) | ||||||||
| Decade | Year-0 | Year-1 | Year-2 | Year-3 | Year-4 | Year-5 | Year-6 | Year-7 | Year-8 | Year-9 |
|---|---|---|---|---|---|---|---|---|---|---|
| 1990's | 1,412.7 | 1,447.5 | 1,493.1 | 1,450.0 | 1,598.7 | 1,558.2 | ||||
| 2000's | 1,630.6 | 1,642.3 | 1,678.4 | 1,763.8 | 1,731.2 | 1,805.4 | 1,880.7 | 1,843.8 | 1,729.3 | 1,833.7 |
| 2010's | 1,794.2 | 1,926.1 | 1,950.2 | 1,916.9 | 1,886.7 | 2,036.8 | 1,996.0 | 2,054.5 | 2,057.2 | 2,085.6 |
| 2020's | 1,965.5 |
| - = No Data Reported; -- = Not Applicable; NA = Not Available; W = Withheld to avoid disclosure of individual company data. |
| Release Date: 6/1/2022 |
| Next Release Date: TBD |