|
Download Data (XLS File) |
|
||||||||
|
||||||||
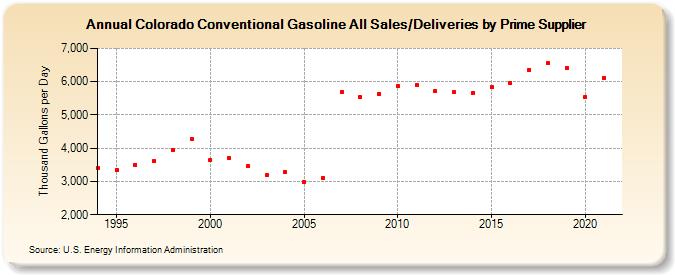
| Colorado Conventional Gasoline All Sales/Deliveries by Prime Supplier (Thousand Gallons per Day) | ||||||||
| Decade | Year-0 | Year-1 | Year-2 | Year-3 | Year-4 | Year-5 | Year-6 | Year-7 | Year-8 | Year-9 |
|---|---|---|---|---|---|---|---|---|---|---|
| 1990's | 3,413.1 | 3,353.8 | 3,505.7 | 3,613.0 | 3,942.2 | 4,280.9 | ||||
| 2000's | 3,648.9 | 3,693.8 | 3,453.6 | 3,185.7 | 3,279.3 | 2,997.6 | 3,112.5 | 5,697.0 | 5,526.1 | 5,637.2 |
| 2010's | 5,862.7 | 5,908.2 | 5,722.7 | 5,674.2 | 5,665.7 | 5,828.9 | 5,945.7 | 6,364.6 | 6,547.2 | 6,411.7 |
| 2020's | 5,537.1 |
| - = No Data Reported; -- = Not Applicable; NA = Not Available; W = Withheld to avoid disclosure of individual company data. |
| Release Date: 6/1/2022 |
| Next Release Date: TBD |