|
Download Data (XLS File) |
|
||||||||
|
||||||||
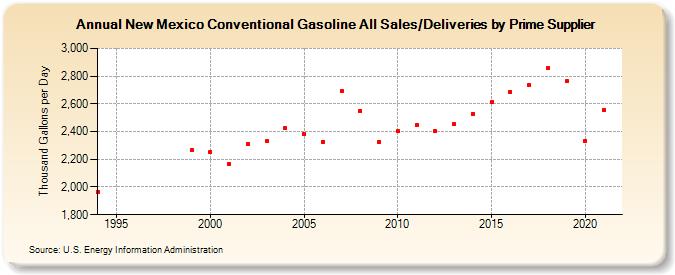
| New Mexico Conventional Gasoline All Sales/Deliveries by Prime Supplier (Thousand Gallons per Day) | ||||||||
| Decade | Year-0 | Year-1 | Year-2 | Year-3 | Year-4 | Year-5 | Year-6 | Year-7 | Year-8 | Year-9 |
|---|---|---|---|---|---|---|---|---|---|---|
| 1990's | 1,963.9 | W | W | W | W | 2,264.7 | ||||
| 2000's | 2,255.6 | 2,168.5 | 2,306.8 | 2,329.8 | 2,425.6 | 2,381.6 | 2,328.0 | 2,695.8 | 2,548.5 | 2,324.2 |
| 2010's | 2,401.0 | 2,446.6 | 2,403.5 | 2,453.5 | 2,529.1 | 2,611.3 | 2,687.9 | 2,733.2 | 2,856.5 | 2,763.5 |
| 2020's | 2,333.5 |
| - = No Data Reported; -- = Not Applicable; NA = Not Available; W = Withheld to avoid disclosure of individual company data. |
| Release Date: 6/1/2022 |
| Next Release Date: TBD |