|
Download Data (XLS File) |
|
||||||||
|
||||||||
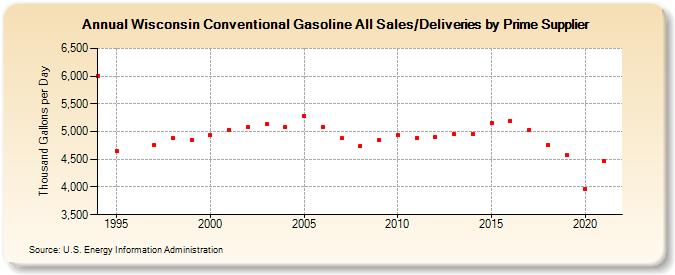
| Wisconsin Conventional Gasoline All Sales/Deliveries by Prime Supplier (Thousand Gallons per Day) | ||||||||
| Decade | Year-0 | Year-1 | Year-2 | Year-3 | Year-4 | Year-5 | Year-6 | Year-7 | Year-8 | Year-9 |
|---|---|---|---|---|---|---|---|---|---|---|
| 1990's | 6,010.5 | 4,652.8 | W | 4,750.8 | 4,883.9 | 4,849.9 | ||||
| 2000's | 4,938.1 | 5,036.0 | 5,075.8 | 5,138.1 | 5,090.9 | 5,283.7 | 5,082.8 | 4,877.2 | 4,747.2 | 4,848.5 |
| 2010's | 4,940.7 | 4,885.1 | 4,900.7 | 4,948.2 | 4,958.7 | 5,161.2 | 5,196.8 | 5,031.5 | 4,764.9 | 4,577.3 |
| 2020's | 3,967.2 |
| - = No Data Reported; -- = Not Applicable; NA = Not Available; W = Withheld to avoid disclosure of individual company data. |
| Release Date: 6/1/2022 |
| Next Release Date: TBD |