|
Download Data (XLS File) |
|
||||||||
|
||||||||
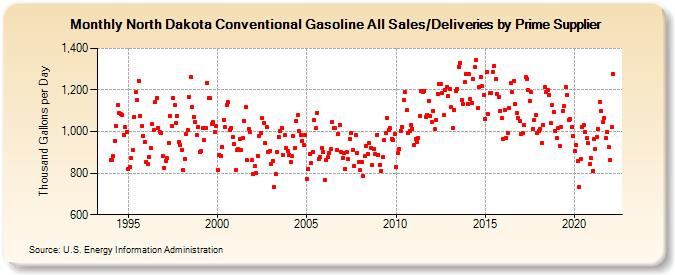
| North Dakota Conventional Gasoline All Sales/Deliveries by Prime Supplier (Thousand Gallons per Day) | ||||||||
| Year | Jan | Feb | Mar | Apr | May | Jun | Jul | Aug | Sep | Oct | Nov | Dec |
|---|---|---|---|---|---|---|---|---|---|---|---|---|
| 1993 | NA | NA | NA | |||||||||
| 1994 | 863.4 | 861.0 | 880.5 | 955.2 | 1,027.5 | 1,125.8 | 1,090.4 | 1,083.7 | 1,079.6 | 984.3 | 1,019.9 | 999.4 |
| 1995 | 821.7 | 829.9 | 871.5 | 912.9 | 1,072.1 | 1,189.5 | 1,151.2 | 1,243.3 | 1,075.0 | 1,027.6 | 980.0 | 950.0 |
| 1996 | 854.4 | 842.1 | 876.2 | 919.6 | 1,035.5 | 1,006.8 | 1,141.3 | 1,162.7 | 1,017.9 | 996.1 | 992.0 | 881.6 |
| 1997 | 825.9 | 858.9 | 870.4 | 947.0 | 1,075.0 | 1,027.1 | 1,162.0 | 1,127.3 | 1,040.3 | 1,076.4 | 951.1 | 933.6 |
| 1998 | 913.3 | 814.0 | 867.1 | 987.9 | 1,006.4 | 1,165.3 | 1,260.6 | 1,115.8 | 1,070.1 | 1,046.5 | 985.2 | 1,024.3 |
| 1999 | 902.9 | 905.4 | 1,016.2 | 957.9 | 1,017.9 | 1,233.2 | 1,161.1 | 1,160.8 | 1,036.7 | 1,043.7 | 1,000.0 | 1,026.3 |
| 2000 | 814.9 | 887.0 | 884.2 | 925.8 | 1,056.9 | 1,021.6 | 1,125.6 | 1,140.3 | 1,008.3 | 1,016.3 | 972.7 | 939.7 |
| 2001 | 813.7 | 910.0 | 915.7 | 961.8 | 910.9 | 968.6 | 1,052.8 | 1,117.1 | 861.5 | 1,012.4 | 998.4 | 861.6 |
| 2002 | 795.9 | 833.3 | 798.3 | 883.4 | 977.8 | 993.5 | 1,065.9 | 1,043.3 | 943.8 | 1,021.7 | 903.4 | 904.1 |
| 2003 | 845.1 | 859.6 | 734.2 | 796.1 | 902.3 | 976.2 | 1,004.7 | 1,018.4 | 886.8 | 983.0 | 922.1 | 908.8 |
| 2004 | 887.3 | 855.4 | 882.1 | 978.0 | 922.5 | 1,051.0 | 1,077.8 | 1,000.3 | 983.4 | 956.5 | 934.2 | 984.6 |
| 2005 | 772.6 | 820.8 | 890.7 | 850.9 | 903.0 | 1,054.5 | 1,015.3 | 1,090.8 | 868.8 | 879.3 | 921.2 | 900.8 |
| 2006 | 768.0 | 863.3 | 876.0 | 897.3 | 916.0 | 1,045.4 | 1,015.5 | 1,016.9 | 911.3 | 989.2 | 1,032.9 | 901.1 |
| 2007 | 872.8 | 895.8 | 819.4 | 900.6 | 866.1 | 965.6 | 993.5 | 913.4 | 833.6 | 983.3 | 896.7 | 853.2 |
| 2008 | 813.4 | 852.3 | 784.9 | 880.4 | 930.0 | 890.1 | 944.9 | 921.2 | 839.0 | 915.2 | 892.9 | 985.7 |
| 2009 | 885.6 | 840.6 | 809.9 | 878.3 | 960.5 | 991.5 | 1,064.7 | 1,006.5 | 1,015.7 | 965.3 | 957.8 | 988.0 |
| 2010 | 830.6 | 894.6 | 916.3 | 1,004.7 | 1,024.2 | 1,153.5 | 1,190.7 | 1,101.6 | 994.7 | 1,005.0 | 1,031.8 | 1,013.8 |
| 2011 | 933.4 | 963.8 | 952.1 | 971.0 | 1,072.5 | 1,193.0 | 1,191.4 | 1,197.3 | 1,072.1 | 1,081.2 | 1,148.3 | 1,074.1 |
| 2012 | 1,046.0 | 1,101.2 | 1,010.2 | 1,056.2 | 1,182.1 | 1,229.3 | 1,230.5 | 1,183.8 | 1,078.1 | 1,201.2 | 1,214.9 | 1,169.8 |
| 2013 | 1,205.7 | 1,119.0 | 1,016.9 | 1,105.5 | 1,196.3 | 1,206.9 | 1,309.8 | 1,331.5 | 1,151.8 | 1,133.6 | 1,236.2 | 1,277.6 |
| 2014 | 1,134.3 | 1,274.8 | 1,154.8 | 1,139.3 | 1,251.6 | 1,308.3 | 1,342.5 | 1,113.8 | 1,212.1 | 1,260.1 | 1,217.1 | 1,174.1 |
| 2015 | 1,062.3 | 1,288.5 | 1,082.2 | 1,183.6 | 1,186.1 | 1,288.3 | 1,316.5 | 1,250.5 | 1,181.5 | 1,165.7 | 1,099.9 | 1,063.9 |
| 2016 | 963.1 | 1,103.0 | 971.0 | 995.3 | 1,115.2 | 1,231.7 | 1,188.5 | 1,242.3 | 1,131.0 | 1,088.6 | 1,066.8 | 1,049.1 |
| 2017 | 987.1 | 993.4 | 1,030.7 | 1,263.0 | 1,255.0 | 1,202.2 | 1,146.7 | 1,187.9 | 1,012.6 | 1,057.7 | 1,078.7 | 992.8 |
| 2018 | 1,002.0 | 1,012.0 | 944.2 | 1,031.1 | 1,212.9 | 1,190.9 | 1,200.6 | 1,174.1 | 1,038.9 | 1,128.5 | 1,096.0 | 1,000.4 |
| 2019 | 968.2 | 1,015.7 | 932.0 | 1,022.8 | 1,100.4 | 1,121.6 | 1,215.3 | 1,176.5 | 1,057.4 | 1,061.1 | 1,020.8 | 979.7 |
| 2020 | 904.5 | 935.1 | 856.9 | 734.2 | 868.8 | 1,023.0 | 1,031.5 | 996.1 | 968.1 | 945.4 | 841.6 | 873.1 |
| 2021 | 808.7 | 965.4 | 914.4 | 972.1 | 1,012.5 | 1,142.4 | 1,100.9 | 1,043.9 | 1,065.8 | 968.2 | 996.8 | 924.0 |
| 2022 | 860.9 | 1,020.1 | 1,278.3 | |||||||||
| - = No Data Reported; -- = Not Applicable; NA = Not Available; W = Withheld to avoid disclosure of individual company data. |
| Release Date: 5/19/2022 |
| Next Release Date: TBD |