|
Download Data (XLS File) |
|
||||||||
|
||||||||
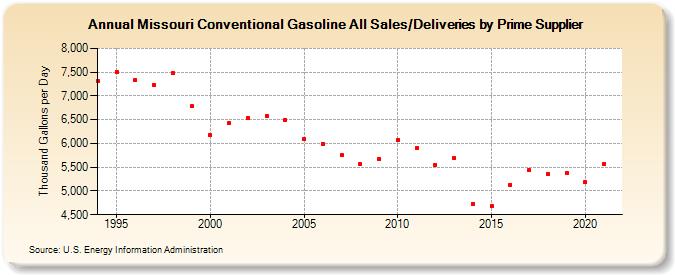
| Missouri Conventional Gasoline All Sales/Deliveries by Prime Supplier (Thousand Gallons per Day) | ||||||||
| Decade | Year-0 | Year-1 | Year-2 | Year-3 | Year-4 | Year-5 | Year-6 | Year-7 | Year-8 | Year-9 |
|---|---|---|---|---|---|---|---|---|---|---|
| 1990's | 7,318.2 | 7,512.2 | 7,335.2 | 7,234.6 | 7,473.3 | 6,786.5 | ||||
| 2000's | 6,169.1 | 6,431.2 | 6,538.4 | 6,580.6 | 6,488.4 | 6,083.3 | 5,990.6 | 5,750.5 | 5,559.5 | 5,667.8 |
| 2010's | 6,072.6 | 5,903.6 | 5,549.4 | 5,694.2 | 4,732.5 | 4,693.7 | 5,134.3 | 5,430.5 | 5,359.0 | 5,375.6 |
| 2020's | 5,179.7 |
| - = No Data Reported; -- = Not Applicable; NA = Not Available; W = Withheld to avoid disclosure of individual company data. |
| Release Date: 6/1/2022 |
| Next Release Date: TBD |