|
Download Data (XLS File) |
|
||||||||
|
||||||||
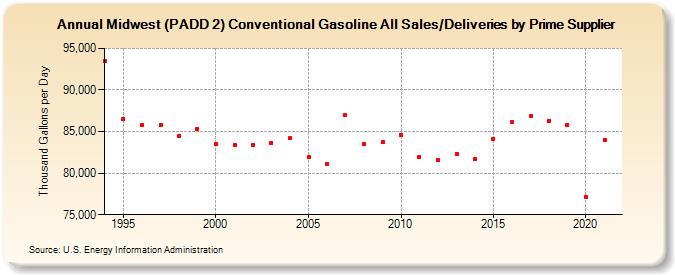
| Midwest (PADD 2) Conventional Gasoline All Sales/Deliveries by Prime Supplier (Thousand Gallons per Day) | ||||||||
| Decade | Year-0 | Year-1 | Year-2 | Year-3 | Year-4 | Year-5 | Year-6 | Year-7 | Year-8 | Year-9 |
|---|---|---|---|---|---|---|---|---|---|---|
| 1990's | 93,518.6 | 86,491.4 | 85,765.3 | 85,833.5 | 84,505.3 | 85,301.4 | ||||
| 2000's | 83,443.8 | 83,336.3 | 83,339.6 | 83,678.7 | 84,174.6 | 81,939.7 | 81,061.3 | 86,998.8 | 83,562.7 | 83,683.7 |
| 2010's | 84,583.9 | 81,911.0 | 81,632.4 | 82,325.0 | 81,731.2 | 84,142.6 | 86,207.8 | 86,915.1 | 86,288.1 | 85,835.4 |
| 2020's | 77,173.6 |
| - = No Data Reported; -- = Not Applicable; NA = Not Available; W = Withheld to avoid disclosure of individual company data. |
| Release Date: 6/1/2022 |
| Next Release Date: TBD |