|
Download Data (XLS File) |
|
||||||||
|
||||||||
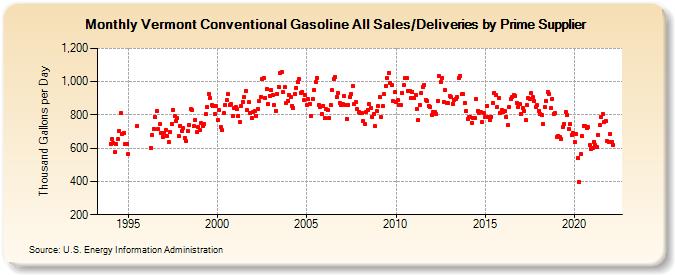
| Vermont Conventional Gasoline All Sales/Deliveries by Prime Supplier (Thousand Gallons per Day) | ||||||||
| Year | Jan | Feb | Mar | Apr | May | Jun | Jul | Aug | Sep | Oct | Nov | Dec |
|---|---|---|---|---|---|---|---|---|---|---|---|---|
| 1993 | NA | NA | NA | |||||||||
| 1994 | 628.1 | 655.0 | 632.3 | 575.3 | 622.6 | 652.9 | 703.9 | 811.2 | 686.2 | 691.6 | 623.1 | 626.2 |
| 1995 | 565.6 | W | W | W | W | W | 734.6 | W | W | W | W | W |
| 1996 | W | W | W | 602.8 | 679.1 | 718.0 | 787.4 | 824.8 | 714.8 | 744.5 | 688.7 | 666.5 |
| 1997 | 689.1 | 710.5 | 671.9 | 635.7 | 700.0 | 748.0 | 830.6 | 793.7 | 764.2 | 780.7 | 672.0 | 735.9 |
| 1998 | 705.2 | 719.9 | 663.0 | 641.5 | 704.5 | 739.9 | 832.6 | 829.4 | 731.3 | 769.8 | 695.5 | 726.8 |
| 1999 | 707.9 | 749.5 | 733.5 | 744.2 | 803.7 | 846.2 | 928.6 | 899.3 | 859.5 | 854.7 | 803.4 | 853.2 |
| 2000 | 770.2 | 828.5 | 728.5 | 706.9 | 809.5 | 861.0 | 886.7 | 923.4 | 859.3 | 864.2 | 791.5 | 838.6 |
| 2001 | 846.9 | 832.8 | 794.9 | 757.6 | 852.3 | 880.1 | 906.6 | 945.7 | 829.5 | 875.8 | 811.1 | 780.8 |
| 2002 | 816.9 | 825.3 | 793.2 | 837.3 | 882.1 | 910.5 | 1,015.0 | 1,024.6 | 903.5 | 953.0 | 863.6 | 915.8 |
| 2003 | 952.4 | 918.3 | 858.6 | 825.1 | 926.9 | 969.5 | 1,051.7 | 1,055.8 | 936.0 | 966.2 | 871.6 | 885.9 |
| 2004 | 921.2 | 910.3 | 856.4 | 840.9 | 926.0 | 964.0 | 997.6 | 1,013.0 | 933.4 | 940.3 | 888.1 | 918.3 |
| 2005 | 858.5 | 894.4 | 868.6 | 796.0 | 897.4 | 952.1 | 995.6 | 1,022.6 | 858.9 | 849.7 | 807.5 | 855.4 |
| 2006 | 779.9 | 832.9 | 829.6 | 781.0 | 860.0 | 948.5 | 1,016.5 | 1,028.2 | 909.0 | 931.7 | 873.5 | 861.9 |
| 2007 | 864.8 | 914.7 | 857.6 | 778.1 | 861.8 | 908.1 | 928.7 | 974.2 | 862.7 | 875.6 | 833.0 | 819.7 |
| 2008 | 810.8 | 811.3 | 762.8 | 745.5 | 815.7 | 832.1 | 863.4 | 840.2 | 784.9 | 805.6 | 731.3 | 822.5 |
| 2009 | 851.4 | 910.6 | 785.6 | 851.7 | 925.6 | 973.4 | 1,023.5 | 1,054.9 | 994.1 | 978.4 | 881.3 | 937.6 |
| 2010 | 875.7 | 886.9 | 862.6 | 861.8 | 934.0 | 978.1 | 1,019.3 | 1,023.5 | 945.8 | 941.1 | 899.0 | 939.0 |
| 2011 | 898.9 | 922.6 | 837.7 | 769.8 | 862.1 | 932.9 | 968.2 | 980.1 | 891.5 | 884.7 | 856.2 | 850.6 |
| 2012 | 801.0 | 816.4 | 819.9 | 803.8 | 886.5 | 1,034.5 | 996.6 | 1,022.4 | 878.0 | 949.5 | 869.8 | 868.9 |
| 2013 | 915.0 | 906.0 | 867.9 | 892.2 | 898.4 | 909.2 | 1,023.5 | 1,034.1 | 923.4 | 924.5 | 872.3 | 821.4 |
| 2014 | 775.1 | 785.4 | 785.4 | 754.2 | 779.8 | 778.8 | 896.9 | 825.2 | 813.7 | 815.3 | 756.3 | 809.4 |
| 2015 | 787.5 | 856.4 | 785.1 | 767.1 | 790.5 | 874.6 | 933.7 | 917.4 | 847.9 | 903.1 | 810.4 | 831.0 |
| 2016 | 820.4 | 825.3 | 786.4 | 737.1 | 845.9 | 894.3 | 909.5 | 921.9 | 915.7 | 873.3 | 845.6 | 864.7 |
| 2017 | 805.6 | 842.4 | 823.0 | 768.6 | 858.9 | 900.3 | 898.4 | 929.0 | 905.2 | 882.7 | 847.3 | 857.3 |
| 2018 | 825.7 | 806.3 | 802.5 | 744.7 | 849.5 | 881.4 | 937.2 | 925.4 | 842.0 | 895.8 | 807.4 | 809.7 |
| 2019 | 666.7 | 674.8 | 669.5 | 654.9 | 725.7 | 744.4 | 818.2 | 799.6 | 716.4 | 745.0 | 679.8 | 692.8 |
| 2020 | 639.8 | 685.7 | 538.8 | 397.4 | 562.9 | 672.8 | 734.9 | 733.0 | 724.0 | 724.8 | 616.4 | 596.7 |
| 2021 | 603.6 | 637.9 | 619.2 | 605.9 | 680.2 | 739.4 | 789.4 | 805.4 | 756.7 | 764.9 | 641.5 | 637.2 |
| 2022 | 685.7 | 634.5 | 620.1 | |||||||||
| - = No Data Reported; -- = Not Applicable; NA = Not Available; W = Withheld to avoid disclosure of individual company data. |
| Release Date: 5/19/2022 |
| Next Release Date: TBD |