|
Download Data (XLS File) |
|
||||||||
|
||||||||
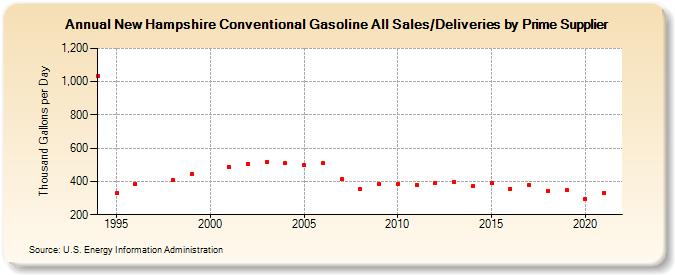
| New Hampshire Conventional Gasoline All Sales/Deliveries by Prime Supplier (Thousand Gallons per Day) | ||||||||
| Decade | Year-0 | Year-1 | Year-2 | Year-3 | Year-4 | Year-5 | Year-6 | Year-7 | Year-8 | Year-9 |
|---|---|---|---|---|---|---|---|---|---|---|
| 1990's | 1,033.8 | 330.2 | 383.2 | W | 408.3 | 447.7 | ||||
| 2000's | W | 489.5 | 506.9 | 518.0 | 508.6 | 498.5 | 509.9 | 412.2 | 353.7 | 384.6 |
| 2010's | 385.7 | 377.3 | 393.6 | 399.5 | 372.5 | 389.8 | 356.8 | 375.8 | 344.4 | 347.5 |
| 2020's | 296.9 |
| - = No Data Reported; -- = Not Applicable; NA = Not Available; W = Withheld to avoid disclosure of individual company data. |
| Release Date: 6/1/2022 |
| Next Release Date: TBD |