|
Download Data (XLS File) |
|
||||||||
|
||||||||
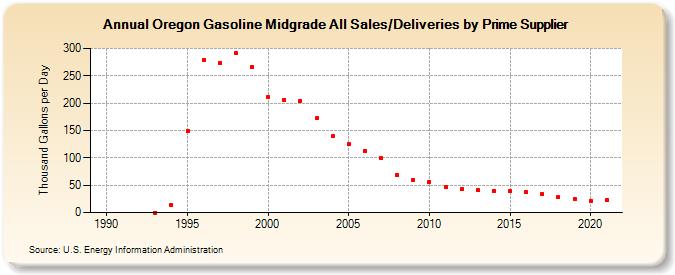
| Oregon Gasoline Midgrade All Sales/Deliveries by Prime Supplier (Thousand Gallons per Day) | ||||||||
| Decade | Year-0 | Year-1 | Year-2 | Year-3 | Year-4 | Year-5 | Year-6 | Year-7 | Year-8 | Year-9 |
|---|---|---|---|---|---|---|---|---|---|---|
| 1980's | W | |||||||||
| 1990's | W | W | W | 0.0 | 13.9 | 149.4 | 278.6 | 273.4 | 291.5 | 266.3 |
| 2000's | 211.3 | 206.6 | 204.0 | 172.0 | 139.1 | 124.8 | 112.8 | 99.9 | 69.2 | 59.9 |
| 2010's | 56.4 | 46.5 | 42.7 | 41.0 | 39.9 | 39.0 | 37.8 | 33.6 | 27.6 | 25.1 |
| 2020's | 21.8 |
| - = No Data Reported; -- = Not Applicable; NA = Not Available; W = Withheld to avoid disclosure of individual company data. |
| Release Date: 6/1/2022 |
| Next Release Date: TBD |