|
Download Data (XLS File) |
|
||||||||
|
||||||||
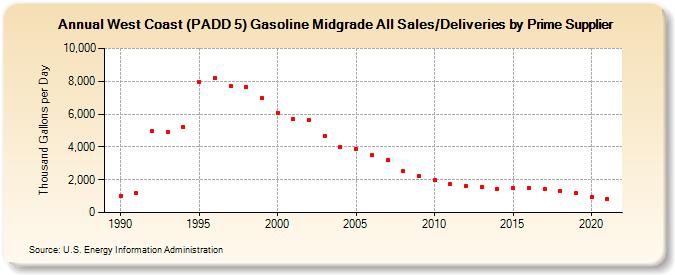
| West Coast (PADD 5) Gasoline Midgrade All Sales/Deliveries by Prime Supplier (Thousand Gallons per Day) | ||||||||
| Decade | Year-0 | Year-1 | Year-2 | Year-3 | Year-4 | Year-5 | Year-6 | Year-7 | Year-8 | Year-9 |
|---|---|---|---|---|---|---|---|---|---|---|
| 1980's | W | |||||||||
| 1990's | 1,005.0 | 1,163.1 | 4,939.3 | 4,916.4 | 5,211.4 | 7,974.0 | 8,226.6 | 7,703.7 | 7,669.5 | 6,967.0 |
| 2000's | 6,074.8 | 5,690.0 | 5,663.7 | 4,692.1 | 4,000.8 | 3,876.0 | 3,487.8 | 3,207.5 | 2,527.9 | 2,235.8 |
| 2010's | 1,952.9 | 1,731.9 | 1,627.7 | 1,583.7 | 1,463.2 | 1,481.3 | 1,516.0 | 1,417.6 | 1,286.2 | 1,183.8 |
| 2020's | 937.2 |
| - = No Data Reported; -- = Not Applicable; NA = Not Available; W = Withheld to avoid disclosure of individual company data. |
| Release Date: 6/1/2022 |
| Next Release Date: TBD |