|
Download Data (XLS File) |
|
||||||||
|
||||||||
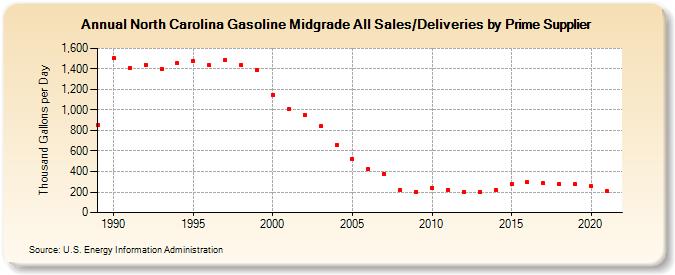
| North Carolina Gasoline Midgrade All Sales/Deliveries by Prime Supplier (Thousand Gallons per Day) | ||||||||
| Decade | Year-0 | Year-1 | Year-2 | Year-3 | Year-4 | Year-5 | Year-6 | Year-7 | Year-8 | Year-9 |
|---|---|---|---|---|---|---|---|---|---|---|
| 1980's | 853.9 | |||||||||
| 1990's | 1,505.0 | 1,409.2 | 1,442.7 | 1,400.5 | 1,455.2 | 1,473.8 | 1,434.2 | 1,486.3 | 1,440.0 | 1,390.9 |
| 2000's | 1,148.3 | 1,004.6 | 952.5 | 840.3 | 661.6 | 523.7 | 421.4 | 379.0 | 215.6 | 205.0 |
| 2010's | 241.5 | 223.3 | 201.6 | 198.1 | 217.1 | 277.5 | 296.0 | 284.1 | 278.9 | 274.8 |
| 2020's | 256.2 |
| - = No Data Reported; -- = Not Applicable; NA = Not Available; W = Withheld to avoid disclosure of individual company data. |
| Release Date: 6/1/2022 |
| Next Release Date: TBD |