|
Download Data (XLS File) |
|
||||||||
|
||||||||
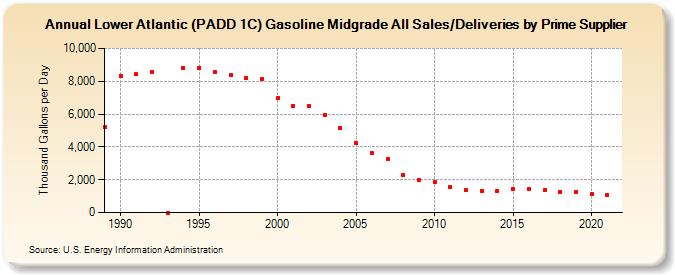
| Lower Atlantic (PADD 1C) Gasoline Midgrade All Sales/Deliveries by Prime Supplier (Thousand Gallons per Day) | ||||||||
| Decade | Year-0 | Year-1 | Year-2 | Year-3 | Year-4 | Year-5 | Year-6 | Year-7 | Year-8 | Year-9 |
|---|---|---|---|---|---|---|---|---|---|---|
| 1980's | 5,208.1 | |||||||||
| 1990's | 8,318.5 | 8,438.2 | 8,590.6 | 0.0 | 8,784.5 | 8,815.7 | 8,573.0 | 8,403.8 | 8,207.5 | 8,143.9 |
| 2000's | 6,963.4 | 6,515.4 | 6,482.5 | 5,964.6 | 5,152.9 | 4,243.1 | 3,607.9 | 3,244.7 | 2,293.4 | 1,998.0 |
| 2010's | 1,833.3 | 1,558.3 | 1,384.0 | 1,329.0 | 1,323.6 | 1,406.8 | 1,423.6 | 1,378.2 | 1,272.7 | 1,249.0 |
| 2020's | 1,132.1 |
| - = No Data Reported; -- = Not Applicable; NA = Not Available; W = Withheld to avoid disclosure of individual company data. |
| Release Date: 6/1/2022 |
| Next Release Date: TBD |