|
Download Data (XLS File) |
|
||||||||
|
||||||||
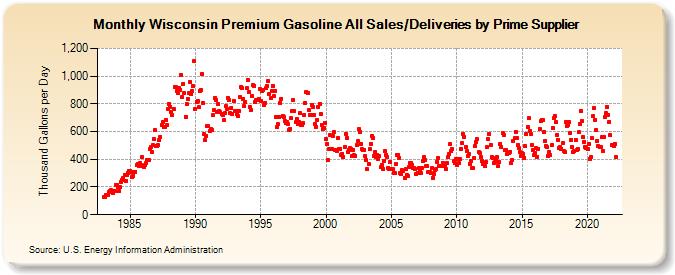
| Wisconsin Premium Gasoline All Sales/Deliveries by Prime Supplier (Thousand Gallons per Day) | ||||||||
| Year | Jan | Feb | Mar | Apr | May | Jun | Jul | Aug | Sep | Oct | Nov | Dec |
|---|---|---|---|---|---|---|---|---|---|---|---|---|
| 1983 | 128.8 | 130.5 | 142.4 | 138.8 | 143.3 | 164.1 | 168.7 | 175.5 | 158.9 | 167.7 | 169.6 | 217.3 |
| 1984 | 216.1 | 197.6 | 174.5 | 201.0 | 234.9 | 249.4 | 265.8 | 287.2 | 246.6 | 285.1 | 303.1 | 315.5 |
| 1985 | 316.7 | 311.6 | 275.1 | 279.7 | 305.4 | 311.3 | 355.8 | 367.3 | 352.8 | 369.6 | 359.9 | 414.5 |
| 1986 | 350.4 | 344.9 | 356.2 | 373.8 | 393.2 | 394.5 | 476.6 | 489.0 | 450.8 | 502.7 | 546.5 | 607.9 |
| 1987 | 494.6 | 494.2 | 500.7 | 536.6 | 563.7 | 646.7 | 670.3 | 629.7 | 631.7 | 685.3 | 645.7 | 762.6 |
| 1988 | 799.1 | 780.1 | 740.5 | 717.7 | 765.0 | 923.5 | 923.4 | 895.6 | 877.2 | 913.5 | 903.3 | 1,011.6 |
| 1989 | 849.3 | 943.3 | 878.8 | 707.8 | 796.4 | 837.2 | 878.1 | 960.0 | 869.1 | 891.5 | 925.9 | 1,107.0 |
| 1990 | 760.9 | 814.3 | 819.2 | 774.2 | 890.3 | 902.0 | 1,017.8 | 806.5 | 580.3 | 535.5 | 568.3 | 637.6 |
| 1991 | 637.2 | 605.5 | 620.9 | 608.6 | 716.2 | 752.1 | 843.5 | 830.7 | 738.8 | 797.7 | 748.6 | 740.6 |
| 1992 | 729.7 | 718.4 | 684.2 | 732.4 | 782.5 | 765.9 | 843.0 | 825.6 | 730.6 | 770.7 | 726.8 | 822.2 |
| 1993 | 744.9 | 748.4 | 724.7 | 714.1 | 748.7 | 846.8 | 923.8 | 910.9 | 835.7 | 782.0 | 815.9 | 910.9 |
| 1994 | 972.5 | 885.3 | 779.7 | 756.4 | 853.6 | 934.8 | 931.0 | 811.1 | 826.4 | 829.0 | 833.6 | 908.7 |
| 1995 | 821.7 | 892.7 | 899.2 | 792.0 | 809.0 | 911.4 | 927.6 | 964.8 | 874.0 | 842.3 | 889.1 | 929.3 |
| 1996 | 853.5 | 892.8 | 708.4 | 630.8 | 651.6 | 705.9 | 805.9 | 837.5 | 710.9 | 705.0 | 676.2 | 660.7 |
| 1997 | 671.7 | 652.4 | 614.2 | 621.9 | 695.0 | 745.0 | 828.4 | 745.7 | 667.3 | 692.5 | 653.0 | 670.9 |
| 1998 | 733.2 | 647.4 | 647.4 | 659.7 | 721.5 | 805.4 | 884.3 | 877.0 | 752.4 | 722.6 | 717.6 | 794.8 |
| 1999 | 777.5 | 720.9 | 657.6 | 634.8 | 686.7 | 774.8 | 799.3 | 727.7 | 650.2 | 620.9 | 628.5 | 663.4 |
| 2000 | 544.8 | 513.1 | 392.8 | 470.8 | 571.7 | 476.9 | 571.1 | 594.5 | 469.5 | 468.4 | 458.7 | 552.0 |
| 2001 | 471.6 | 474.7 | 429.8 | 440.0 | 413.8 | 485.3 | 584.7 | 552.6 | 452.6 | 469.1 | 480.8 | 477.4 |
| 2002 | 426.8 | 466.9 | 428.9 | 426.6 | 501.7 | 530.2 | 615.5 | 596.6 | 513.5 | 470.9 | 464.8 | 470.2 |
| 2003 | 422.4 | 394.7 | 327.2 | 369.4 | 471.1 | 513.8 | 568.4 | 551.9 | 425.0 | 451.9 | 416.0 | 431.8 |
| 2004 | 404.0 | 420.7 | 343.5 | 361.2 | 330.6 | 390.7 | 456.5 | 430.5 | 412.8 | 339.9 | 329.6 | 383.0 |
| 2005 | 328.6 | 326.5 | 303.7 | 297.4 | 366.8 | 433.6 | 434.3 | 411.5 | 304.5 | 294.3 | 320.4 | 317.9 |
| 2006 | 267.2 | 329.4 | 288.8 | 278.2 | 341.9 | 372.6 | 373.9 | 358.6 | 339.3 | 336.3 | 331.2 | 296.0 |
| 2007 | 304.5 | 334.6 | 312.1 | 302.2 | 334.2 | 385.2 | 412.9 | 398.2 | 349.7 | 351.2 | 307.6 | 310.1 |
| 2008 | 301.5 | 335.9 | 267.7 | 292.5 | 323.9 | 328.8 | 382.8 | 411.5 | 349.7 | 349.1 | 349.0 | 376.4 |
| 2009 | 355.8 | 350.5 | 332.8 | 370.1 | 415.1 | 438.7 | 506.8 | 457.8 | 472.0 | 384.7 | 371.5 | 400.4 |
| 2010 | 362.2 | 400.3 | 369.8 | 402.6 | 476.6 | 514.2 | 580.0 | 560.9 | 490.2 | 456.1 | 425.6 | 435.4 |
| 2011 | 369.4 | 389.3 | 335.9 | 337.4 | 407.4 | 496.7 | 524.3 | 542.9 | 451.2 | 448.7 | 416.4 | 390.9 |
| 2012 | 367.2 | 369.1 | 350.5 | 379.0 | 488.1 | 544.2 | 582.4 | 505.5 | 416.4 | 408.2 | 373.8 | 383.6 |
| 2013 | 392.3 | 415.0 | 348.4 | 376.8 | 512.8 | 491.8 | 586.0 | 576.0 | 464.1 | 466.2 | 435.7 | 441.8 |
| 2014 | 446.6 | 456.0 | 369.8 | 398.0 | 534.6 | 551.1 | 598.4 | 550.6 | 503.0 | 480.8 | 451.4 | 420.1 |
| 2015 | 443.1 | 440.9 | 412.0 | 492.8 | 581.0 | 631.1 | 694.8 | 607.2 | 584.3 | 503.1 | 468.3 | 428.5 |
| 2016 | 448.8 | 480.2 | 418.4 | 477.7 | 617.1 | 675.4 | 685.8 | 682.4 | 599.7 | 535.1 | 495.7 | 486.0 |
| 2017 | 424.8 | 451.5 | 429.4 | 500.7 | 625.5 | 694.5 | 714.2 | 668.9 | 577.2 | 542.3 | 480.8 | 487.4 |
| 2018 | 477.4 | 514.0 | 461.6 | 454.0 | 666.0 | 639.7 | 648.6 | 669.8 | 591.2 | 541.7 | 487.7 | 455.8 |
| 2019 | 457.3 | 540.8 | 465.2 | 473.4 | 595.4 | 653.1 | 751.5 | 675.8 | 559.2 | 525.8 | 490.7 | 479.9 |
| 2020 | 477.7 | 510.1 | 404.3 | 418.5 | 556.3 | 708.8 | 769.4 | 685.2 | 609.9 | 534.6 | 495.0 | 485.1 |
| 2021 | 488.8 | 559.4 | 458.2 | 562.0 | 702.9 | 733.2 | 777.6 | 722.5 | 670.1 | 573.1 | 504.5 | 500.0 |
| 2022 | 494.2 | 512.2 | 416.1 | |||||||||
| - = No Data Reported; -- = Not Applicable; NA = Not Available; W = Withheld to avoid disclosure of individual company data. |
| Release Date: 5/19/2022 |
| Next Release Date: TBD |