|
Download Data (XLS File) |
|
||||||||
|
||||||||
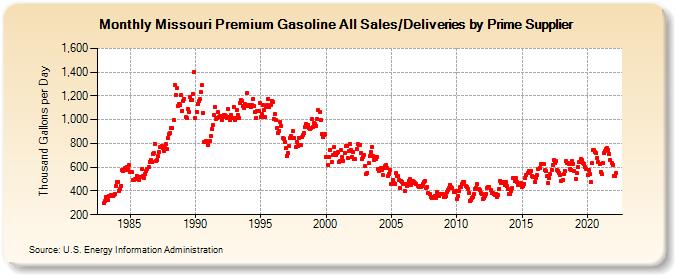
| Missouri Premium Gasoline All Sales/Deliveries by Prime Supplier (Thousand Gallons per Day) | ||||||||
| Year | Jan | Feb | Mar | Apr | May | Jun | Jul | Aug | Sep | Oct | Nov | Dec |
|---|---|---|---|---|---|---|---|---|---|---|---|---|
| 1983 | 297.4 | 315.1 | 345.2 | 326.3 | 321.1 | 356.8 | 361.3 | 366.8 | 358.5 | 364.2 | 378.0 | 440.6 |
| 1984 | 477.8 | 478.8 | 400.2 | 418.6 | 444.6 | 575.3 | 567.3 | 589.9 | 576.8 | 603.3 | 584.3 | 616.0 |
| 1985 | 563.1 | 560.4 | 555.7 | 489.9 | 493.0 | 500.5 | 528.1 | 517.6 | 495.1 | 519.8 | 520.3 | 582.2 |
| 1986 | 522.7 | 511.1 | 544.7 | 567.4 | 588.0 | 599.0 | 646.6 | 662.4 | 641.7 | 707.1 | 716.5 | 798.0 |
| 1987 | 656.0 | 659.9 | 690.4 | 731.1 | 770.5 | 775.5 | 757.8 | 737.5 | 761.0 | 792.3 | 752.4 | 842.9 |
| 1988 | 877.2 | 889.8 | 926.8 | 930.0 | 995.8 | 1,294.9 | 1,208.9 | 1,265.2 | 1,115.5 | 1,128.9 | 1,121.2 | 1,207.2 |
| 1989 | 1,076.4 | 1,160.1 | 1,178.1 | 1,018.8 | 1,010.4 | 1,089.2 | 1,065.0 | 1,193.5 | 1,162.7 | 1,166.4 | 1,219.4 | 1,402.9 |
| 1990 | 1,017.4 | 1,068.0 | 1,130.4 | 1,154.4 | 1,171.7 | 1,233.6 | 1,288.7 | 1,060.1 | 809.5 | 813.7 | 819.0 | 809.7 |
| 1991 | 787.1 | 819.0 | 864.6 | 921.1 | 951.7 | 1,037.6 | 1,104.6 | 1,009.8 | 1,010.0 | 1,062.3 | 1,019.9 | 1,034.7 |
| 1992 | 998.2 | 1,022.4 | 1,043.3 | 1,039.3 | 1,034.9 | 1,015.7 | 1,085.8 | 1,024.4 | 998.8 | 1,039.0 | 1,014.2 | 1,109.3 |
| 1993 | 993.1 | 1,016.8 | 1,083.2 | 1,039.8 | 1,010.4 | 1,144.5 | 1,167.4 | 1,158.4 | 1,117.8 | 1,098.8 | 1,128.6 | 1,221.2 |
| 1994 | 1,114.2 | 1,127.0 | 1,114.1 | 1,108.5 | 1,120.6 | 1,170.1 | 1,114.5 | 1,061.1 | 1,014.8 | 1,076.9 | 1,068.9 | 1,143.8 |
| 1995 | 1,023.6 | 1,045.3 | 1,127.5 | 1,084.7 | 1,018.7 | 1,110.0 | 1,123.3 | 1,177.8 | 1,107.7 | 1,124.4 | 1,161.2 | 1,152.1 |
| 1996 | 1,002.7 | 1,043.8 | 996.9 | 927.8 | 890.7 | 907.8 | 978.3 | 949.5 | 844.6 | 835.7 | 810.0 | 758.4 |
| 1997 | 698.4 | 718.9 | 775.9 | 841.6 | 858.4 | 848.2 | 904.5 | 845.1 | 766.1 | 815.2 | 776.6 | 849.6 |
| 1998 | 782.6 | 788.7 | 850.0 | 872.3 | 886.2 | 941.2 | 965.3 | 959.3 | 926.0 | 921.6 | 933.0 | 1,004.1 |
| 1999 | 935.5 | 969.9 | 962.1 | 950.4 | 1,005.8 | 1,078.7 | 1,063.1 | 999.5 | 880.7 | 851.1 | 874.8 | 875.8 |
| 2000 | 686.6 | 686.1 | 615.7 | 684.9 | 747.9 | 640.8 | 702.5 | 766.5 | 719.3 | 700.2 | 716.8 | 729.6 |
| 2001 | 640.4 | 655.3 | 740.8 | 683.8 | 653.8 | 720.3 | 775.4 | 777.7 | 673.5 | 732.5 | 798.4 | 743.1 |
| 2002 | 687.4 | 725.6 | 666.1 | 669.1 | 749.3 | 792.2 | 786.3 | 790.1 | 722.3 | 667.0 | 689.3 | 703.3 |
| 2003 | 609.0 | 542.8 | 554.4 | 632.0 | 694.1 | 726.7 | 771.3 | 694.8 | 657.3 | 682.4 | 673.1 | 687.2 |
| 2004 | 586.3 | 571.2 | 592.0 | 578.4 | 535.8 | 592.6 | 607.8 | 614.8 | 595.9 | 529.5 | 546.9 | 578.2 |
| 2005 | 456.2 | 496.3 | 464.6 | 460.8 | 548.9 | 525.9 | 528.6 | 493.3 | 420.8 | 487.5 | 479.4 | 460.6 |
| 2006 | 402.1 | 459.1 | 440.3 | 446.0 | 482.2 | 497.1 | 451.4 | 465.2 | 479.6 | 473.7 | 465.9 | 458.3 |
| 2007 | 440.0 | 435.0 | 442.7 | 435.7 | 437.5 | 461.3 | 471.7 | 483.5 | 427.7 | 437.3 | 381.2 | 371.1 |
| 2008 | 352.9 | 344.0 | 346.1 | 352.4 | 357.5 | 343.6 | 387.1 | 376.9 | 359.8 | 376.9 | 371.1 | 373.1 |
| 2009 | 347.7 | 349.9 | 357.1 | 390.7 | 409.0 | 425.2 | 452.7 | 431.8 | 423.6 | 389.7 | 387.5 | 398.2 |
| 2010 | 334.1 | 359.4 | 397.3 | 436.3 | 432.9 | 462.6 | 477.6 | 475.4 | 444.3 | 433.6 | 416.5 | 381.5 |
| 2011 | 318.0 | 325.1 | 343.2 | 353.0 | 376.2 | 415.7 | 425.7 | 456.2 | 414.8 | 408.8 | 383.7 | 375.4 |
| 2012 | 334.2 | 342.4 | 357.8 | 376.5 | 428.0 | 434.7 | 431.3 | 412.2 | 383.8 | 380.5 | 377.1 | 362.9 |
| 2013 | 374.9 | 348.7 | 365.4 | 417.2 | 486.2 | 467.1 | 472.7 | 467.2 | 451.5 | 471.9 | 440.4 | 416.9 |
| 2014 | 374.1 | 373.8 | 400.6 | 428.4 | 510.0 | 480.6 | 507.7 | 473.2 | 453.6 | 462.1 | 454.5 | 465.6 |
| 2015 | 431.8 | 439.3 | 456.8 | 511.8 | 531.1 | 554.3 | 568.8 | 560.6 | 570.6 | 528.1 | 513.7 | 515.9 |
| 2016 | 472.2 | 512.3 | 530.8 | 583.2 | 596.3 | 626.7 | 626.9 | 629.3 | 623.7 | 572.6 | 567.0 | 525.0 |
| 2017 | 465.2 | 507.5 | 540.5 | 578.3 | 622.5 | 658.1 | 631.5 | 648.4 | 574.5 | 571.3 | 555.2 | 537.1 |
| 2018 | 481.1 | 489.5 | 542.2 | 571.0 | 649.7 | 635.0 | 633.3 | 630.6 | 587.8 | 575.1 | 650.5 | 630.7 |
| 2019 | 565.3 | 501.1 | 552.4 | 600.1 | 641.3 | 647.8 | 669.6 | 657.9 | 633.0 | 629.3 | 598.7 | 587.3 |
| 2020 | 531.8 | 573.2 | 542.4 | 474.4 | 632.8 | 744.0 | 742.2 | 728.2 | 718.8 | 681.0 | 642.5 | 624.2 |
| 2021 | 561.7 | 541.2 | 638.1 | 721.3 | 733.5 | 754.9 | 761.3 | 744.5 | 715.2 | 658.9 | 638.2 | 617.5 |
| 2022 | 528.6 | 523.4 | 549.2 | |||||||||
| - = No Data Reported; -- = Not Applicable; NA = Not Available; W = Withheld to avoid disclosure of individual company data. |
| Release Date: 5/19/2022 |
| Next Release Date: TBD |