|
Download Data (XLS File) |
|
||||||||
|
||||||||
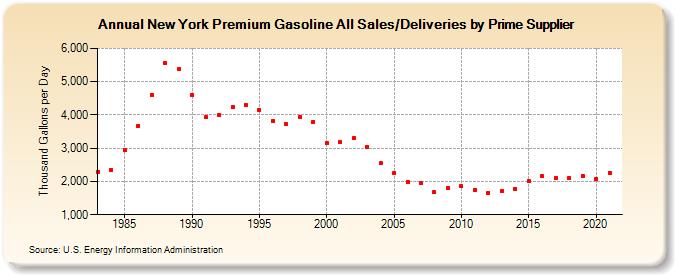
| New York Premium Gasoline All Sales/Deliveries by Prime Supplier (Thousand Gallons per Day) | ||||||||
| Decade | Year-0 | Year-1 | Year-2 | Year-3 | Year-4 | Year-5 | Year-6 | Year-7 | Year-8 | Year-9 |
|---|---|---|---|---|---|---|---|---|---|---|
| 1980's | 2,272.7 | 2,352.2 | 2,943.3 | 3,674.5 | 4,610.8 | 5,561.1 | 5,366.6 | |||
| 1990's | 4,609.4 | 3,932.3 | 4,008.9 | 4,236.9 | 4,293.4 | 4,154.8 | 3,820.7 | 3,714.7 | 3,950.6 | 3,799.3 |
| 2000's | 3,155.0 | 3,175.7 | 3,313.6 | 3,028.5 | 2,539.7 | 2,260.9 | 1,987.8 | 1,960.3 | 1,673.4 | 1,796.1 |
| 2010's | 1,852.7 | 1,741.4 | 1,662.6 | 1,709.7 | 1,786.6 | 2,003.4 | 2,155.5 | 2,117.7 | 2,110.4 | 2,167.9 |
| 2020's | 2,085.1 |
| - = No Data Reported; -- = Not Applicable; NA = Not Available; W = Withheld to avoid disclosure of individual company data. |
| Release Date: 6/1/2022 |
| Next Release Date: TBD |