|
Download Data (XLS File) |
|
||||||||
|
||||||||
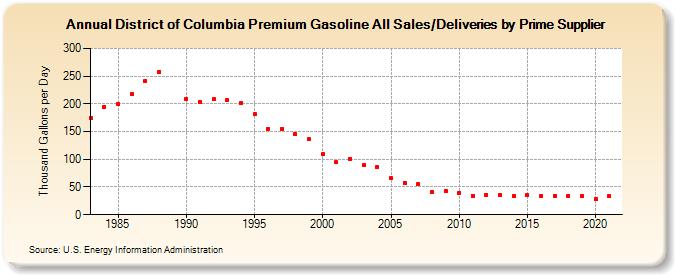
| District of Columbia Premium Gasoline All Sales/Deliveries by Prime Supplier (Thousand Gallons per Day) | ||||||||
| Decade | Year-0 | Year-1 | Year-2 | Year-3 | Year-4 | Year-5 | Year-6 | Year-7 | Year-8 | Year-9 |
|---|---|---|---|---|---|---|---|---|---|---|
| 1980's | 174.3 | 194.3 | 199.3 | 217.9 | 240.8 | 257.5 | W | |||
| 1990's | 209.3 | 202.7 | 208.1 | 206.4 | 201.2 | 180.8 | 155.3 | 155.2 | 145.0 | 136.0 |
| 2000's | 108.9 | 94.9 | 100.7 | 89.3 | 85.8 | 65.7 | 57.9 | 54.5 | 41.7 | 42.1 |
| 2010's | 40.0 | 34.4 | 36.2 | 35.6 | 33.4 | 34.8 | 34.3 | 33.8 | 33.8 | 33.7 |
| 2020's | 27.9 |
| - = No Data Reported; -- = Not Applicable; NA = Not Available; W = Withheld to avoid disclosure of individual company data. |
| Release Date: 6/1/2022 |
| Next Release Date: TBD |