|
Download Data (XLS File) |
|
||||||||
|
||||||||
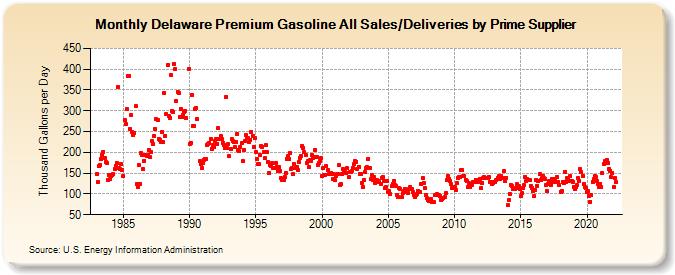
| Delaware Premium Gasoline All Sales/Deliveries by Prime Supplier (Thousand Gallons per Day) | ||||||||
| Year | Jan | Feb | Mar | Apr | May | Jun | Jul | Aug | Sep | Oct | Nov | Dec |
|---|---|---|---|---|---|---|---|---|---|---|---|---|
| 1983 | 147.6 | 128.8 | 166.1 | 169.9 | 182.9 | 193.7 | 201.6 | 187.5 | 176.9 | 174.3 | 133.4 | 145.9 |
| 1984 | 134.8 | 142.4 | 144.7 | 147.1 | 159.4 | 168.1 | 175.4 | 357.4 | 161.2 | 160.1 | 171.1 | 158.0 |
| 1985 | 142.8 | 277.1 | 267.2 | 303.9 | 384.0 | 382.7 | 256.6 | 290.0 | 248.5 | 242.3 | 246.3 | 311.8 |
| 1986 | 124.4 | 116.6 | 169.9 | 125.0 | 197.4 | 193.1 | 159.8 | 180.3 | 193.9 | 191.4 | 192.6 | 206.1 |
| 1987 | 189.0 | 200.3 | 226.1 | 219.6 | 240.2 | 255.6 | 279.9 | 278.1 | 231.6 | 229.6 | 225.8 | 249.2 |
| 1988 | 224.7 | 343.7 | 240.2 | 291.5 | 409.5 | 286.9 | 283.6 | 387.2 | 298.8 | 295.9 | 412.2 | 399.5 |
| 1989 | 323.0 | 345.0 | 343.3 | 285.2 | 305.0 | 285.9 | 291.0 | 297.3 | 299.7 | 283.2 | W | 400.9 |
| 1990 | 220.1 | 223.4 | 339.0 | 262.8 | 264.0 | 303.2 | 306.1 | 281.3 | W | 178.3 | 171.8 | 162.2 |
| 1991 | 174.0 | 182.7 | 183.8 | 183.6 | 218.6 | 221.1 | 222.6 | 232.5 | 208.4 | 218.3 | 212.8 | 228.4 |
| 1992 | 232.2 | 220.8 | 257.6 | 233.2 | 238.8 | 232.7 | 223.1 | 218.8 | 209.9 | 333.8 | 210.2 | 219.6 |
| 1993 | 190.2 | 208.8 | 232.3 | 226.2 | 223.9 | 213.5 | 225.8 | 243.7 | 205.0 | 202.7 | 213.5 | 222.2 |
| 1994 | 178.8 | 205.8 | 227.5 | 241.0 | 234.6 | 233.6 | 224.0 | 230.5 | 249.7 | 240.4 | 213.8 | 234.7 |
| 1995 | 200.9 | 183.1 | 172.4 | 171.2 | 193.5 | 215.5 | 213.6 | 200.5 | 185.5 | 216.9 | 200.6 | 177.6 |
| 1996 | 150.5 | 169.2 | 167.2 | 174.3 | 161.9 | 163.5 | 173.5 | 165.1 | 154.5 | 163.9 | 155.9 | 137.5 |
| 1997 | 133.8 | 132.5 | 141.5 | 151.3 | 184.2 | 190.1 | 183.9 | 198.8 | 159.3 | 161.4 | 147.9 | 171.3 |
| 1998 | 162.5 | 164.0 | 158.0 | 177.9 | 186.7 | 191.8 | 216.0 | 211.4 | 199.7 | 193.1 | 175.4 | 179.0 |
| 1999 | 164.1 | 181.3 | 180.3 | 194.8 | 186.7 | 188.8 | 206.0 | 189.6 | 169.1 | 174.9 | 179.6 | 185.9 |
| 2000 | 142.5 | 162.0 | 145.1 | 146.6 | 166.7 | 156.9 | 147.9 | 149.3 | 151.0 | 146.9 | 136.2 | 146.8 |
| 2001 | 132.4 | 144.1 | 149.1 | 168.8 | 122.2 | 122.7 | 147.8 | 160.4 | 156.1 | 151.7 | 151.3 | 161.5 |
| 2002 | 140.4 | 151.8 | 153.6 | 155.3 | 162.3 | 171.2 | 178.2 | 177.4 | 161.1 | 165.4 | 148.7 | 149.0 |
| 2003 | 127.2 | 117.1 | 134.2 | 152.3 | 162.3 | 163.7 | 185.0 | 162.0 | 134.9 | 146.0 | 133.4 | 140.5 |
| 2004 | 125.5 | 133.5 | 132.8 | 132.1 | 127.9 | 124.9 | 138.3 | 140.8 | 131.0 | 114.8 | 117.7 | 130.7 |
| 2005 | 105.7 | 106.4 | 99.8 | 118.1 | 124.8 | 131.9 | 120.9 | 119.1 | 96.4 | 92.8 | 114.2 | 111.5 |
| 2006 | 91.6 | 101.6 | 106.5 | 112.6 | 109.4 | 103.5 | 102.6 | 111.4 | 117.1 | 110.8 | 105.0 | 98.6 |
| 2007 | 91.7 | 97.4 | 100.4 | 106.5 | 104.2 | 103.6 | 123.5 | 138.4 | 126.5 | 114.8 | 97.3 | 89.3 |
| 2008 | 86.4 | 83.6 | 82.7 | 87.5 | 81.7 | 80.8 | 96.7 | 98.0 | 99.3 | 96.9 | 96.8 | 95.5 |
| 2009 | 86.2 | 86.6 | 89.4 | 91.8 | 101.1 | 132.3 | 143.5 | 136.0 | 130.2 | 123.0 | 115.0 | 114.5 |
| 2010 | 117.6 | 108.5 | 125.9 | 139.4 | 139.8 | 140.9 | 156.5 | 157.4 | 143.8 | 142.9 | 134.4 | 130.1 |
| 2011 | 116.9 | 126.0 | 115.5 | 120.6 | 120.4 | 127.7 | 127.8 | 134.2 | 133.6 | 128.0 | 129.9 | 136.7 |
| 2012 | 113.3 | 125.9 | 138.1 | 140.8 | 138.7 | 137.5 | 139.2 | 140.9 | 128.2 | 128.3 | 125.0 | 126.2 |
| 2013 | 128.2 | 128.8 | 134.2 | 139.3 | 142.2 | 135.7 | 142.3 | 137.8 | 139.4 | 154.4 | 130.6 | 138.7 |
| 2014 | 72.4 | 85.3 | 100.9 | 121.6 | 119.6 | 111.4 | 112.9 | 112.1 | 113.3 | 123.2 | 119.0 | 110.8 |
| 2015 | 94.3 | 102.1 | 115.2 | 120.8 | 141.2 | 132.1 | 136.3 | 134.1 | 132.5 | 120.0 | 114.3 | 107.5 |
| 2016 | 95.2 | 109.4 | 133.8 | 120.1 | 130.4 | 147.5 | 133.9 | 137.7 | 143.8 | 137.6 | 137.0 | 122.6 |
| 2017 | 106.8 | 123.1 | 130.1 | 122.6 | 136.5 | 127.6 | 135.3 | 135.0 | 128.6 | 140.6 | 129.1 | 120.9 |
| 2018 | 105.3 | 106.1 | 129.6 | 125.4 | 153.8 | 128.3 | 137.6 | 134.6 | 131.7 | 143.0 | 131.2 | 127.6 |
| 2019 | 117.8 | 110.8 | 116.6 | 120.6 | 137.5 | 131.2 | 160.2 | 153.0 | 144.3 | 123.6 | 116.9 | 114.4 |
| 2020 | 104.5 | 106.4 | 95.6 | 81.6 | 96.7 | 128.8 | 134.9 | 142.1 | 141.5 | 129.9 | 123.2 | 117.4 |
| 2021 | 124.5 | 117.6 | 150.5 | 171.5 | 178.1 | 173.4 | 181.9 | 174.6 | 160.3 | 156.0 | 139.7 | 151.0 |
| 2022 | 116.2 | 138.8 | 129.4 | |||||||||
| - = No Data Reported; -- = Not Applicable; NA = Not Available; W = Withheld to avoid disclosure of individual company data. |
| Release Date: 5/19/2022 |
| Next Release Date: TBD |