|
Download Data (XLS File) |
|
||||||||
|
||||||||
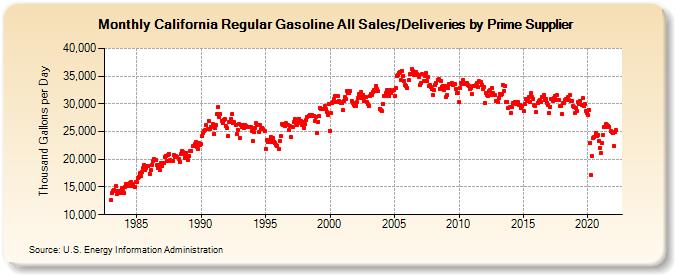
| California Regular Gasoline All Sales/Deliveries by Prime Supplier (Thousand Gallons per Day) | ||||||||
| Year | Jan | Feb | Mar | Apr | May | Jun | Jul | Aug | Sep | Oct | Nov | Dec |
|---|---|---|---|---|---|---|---|---|---|---|---|---|
| 1983 | 12,586.2 | 13,939.6 | 14,319.3 | 14,529.0 | 14,249.9 | 15,220.2 | 13,674.7 | 14,289.6 | 14,343.6 | 13,943.8 | 14,834.9 | 14,326.7 |
| 1984 | 13,919.0 | 15,050.5 | 15,450.8 | 15,622.9 | 15,402.0 | 15,167.0 | 15,757.8 | 15,940.8 | 15,124.4 | 15,497.6 | 14,924.0 | 15,826.4 |
| 1985 | 15,888.3 | 16,642.2 | 16,863.0 | 17,440.5 | 16,987.4 | 17,736.1 | 18,484.0 | 18,949.9 | 18,026.8 | 18,499.1 | 18,745.6 | 18,790.9 |
| 1986 | 17,357.4 | 17,976.7 | 18,993.8 | 19,644.9 | 20,093.6 | 19,871.1 | 19,806.3 | 19,008.7 | 18,342.0 | 18,917.7 | 18,055.1 | 19,246.8 |
| 1987 | 18,839.4 | 19,415.8 | 20,488.0 | 20,680.3 | 19,726.5 | 20,708.8 | 20,996.9 | 19,780.3 | 19,669.1 | 19,709.7 | 19,742.8 | 20,742.0 |
| 1988 | 20,378.0 | 20,502.2 | 20,433.8 | 20,053.7 | 19,490.8 | 20,906.5 | 21,502.8 | 21,353.0 | 20,911.6 | 20,277.2 | 21,135.1 | 20,328.3 |
| 1989 | 19,856.3 | 20,571.4 | 21,467.0 | 21,530.3 | 22,392.8 | 22,455.0 | 22,728.4 | 23,100.6 | 22,172.1 | 21,860.9 | 22,886.5 | 22,594.9 |
| 1990 | 22,678.6 | 24,160.1 | 24,738.3 | 25,189.2 | 25,247.3 | 26,100.6 | 25,500.9 | 26,935.6 | 25,502.4 | 25,881.7 | 25,785.5 | 26,401.5 |
| 1991 | 24,572.7 | 25,712.5 | 26,238.3 | 28,241.0 | 29,396.7 | 27,570.8 | 28,186.7 | 26,962.5 | 26,469.3 | 27,173.6 | 27,266.4 | 25,988.3 |
| 1992 | 25,639.7 | 24,263.4 | 26,722.2 | 26,764.1 | 27,293.1 | 28,215.1 | 26,561.4 | 26,648.5 | 26,133.6 | 24,540.6 | 25,305.8 | 26,342.5 |
| 1993 | 23,899.0 | 26,109.0 | 25,810.5 | 26,153.2 | 25,595.2 | 26,221.0 | 25,965.5 | 25,907.1 | 25,742.4 | 25,826.3 | 25,811.0 | 25,093.1 |
| 1994 | 23,275.2 | 24,897.4 | 25,617.4 | 26,560.3 | 26,217.4 | 26,244.5 | 24,989.8 | 26,222.5 | 25,387.0 | 25,670.4 | 25,414.2 | 25,021.4 |
| 1995 | 21,921.9 | 23,523.5 | 23,047.5 | 23,132.1 | 23,556.5 | 24,082.0 | 23,035.5 | 23,771.3 | 23,169.6 | 22,891.9 | 22,564.7 | 22,435.1 |
| 1996 | 21,817.3 | 23,265.4 | 24,181.2 | 26,344.4 | 26,195.0 | 26,426.7 | 25,982.0 | 26,476.8 | 26,153.2 | 26,117.8 | 25,279.2 | 25,917.5 |
| 1997 | 23,977.5 | 25,793.9 | 26,676.2 | 27,284.3 | 26,578.7 | 26,249.6 | 26,585.6 | 27,342.7 | 26,915.3 | 26,988.9 | 26,215.4 | 26,714.0 |
| 1998 | 25,683.3 | 26,273.0 | 27,051.1 | 27,642.7 | 27,872.3 | 28,015.3 | 27,887.4 | 27,933.7 | 27,791.1 | 27,888.1 | 26,959.5 | 27,675.9 |
| 1999 | 24,790.9 | 26,774.8 | 27,732.5 | 29,300.6 | 29,042.9 | 29,144.7 | 29,143.8 | 29,570.2 | 29,008.8 | 28,449.5 | 28,026.1 | 29,995.0 |
| 2000 | 25,183.2 | 28,340.4 | 30,154.1 | 30,418.1 | 30,850.8 | 31,324.2 | 30,364.7 | 31,466.7 | 30,573.7 | 30,284.6 | 30,129.7 | 30,236.3 |
| 2001 | 28,882.7 | 30,441.5 | 31,254.9 | 30,899.8 | 32,272.8 | 32,024.6 | 31,883.3 | 32,258.1 | 30,513.1 | 30,209.1 | 29,849.3 | 29,558.3 |
| 2002 | 29,689.1 | 30,288.3 | 30,976.2 | 31,692.0 | 31,465.8 | 32,217.8 | 31,045.1 | 31,676.5 | 30,427.2 | 31,269.1 | 30,340.5 | 29,963.5 |
| 2003 | 29,692.0 | 31,409.2 | 31,855.0 | 31,595.1 | 32,184.4 | 32,426.7 | 32,393.2 | 33,194.2 | 32,598.9 | 32,234.8 | 29,124.9 | 28,932.9 |
| 2004 | 28,632.5 | 30,056.8 | 31,393.2 | 31,445.8 | 31,909.0 | 32,450.9 | 31,739.6 | 31,478.6 | 32,471.0 | 32,028.0 | 32,230.4 | 32,414.1 |
| 2005 | 31,339.7 | 32,842.1 | 35,066.4 | 35,248.7 | 35,500.1 | 35,792.3 | 34,364.3 | 36,010.5 | 35,095.1 | 34,167.6 | 33,468.4 | 33,264.2 |
| 2006 | 32,912.6 | 34,221.9 | 35,335.0 | 35,425.1 | 36,283.9 | 35,957.7 | 35,264.5 | 35,625.8 | 35,671.0 | 35,352.0 | 35,182.7 | 34,899.5 |
| 2007 | 33,341.5 | 33,745.4 | 35,308.3 | 34,145.7 | 35,079.5 | 35,561.4 | 34,156.6 | 34,846.6 | 33,240.5 | 33,432.0 | 32,958.4 | 32,587.3 |
| 2008 | 31,608.2 | 32,486.9 | 33,324.5 | 33,755.1 | 34,373.8 | 34,402.9 | 32,764.2 | 34,194.6 | 33,088.9 | 33,240.0 | 32,576.4 | 33,225.1 |
| 2009 | 31,232.8 | 31,612.5 | 32,779.9 | 33,526.2 | 33,548.4 | 33,747.0 | 33,331.1 | 33,506.2 | 33,499.8 | 32,683.0 | 31,939.5 | 31,987.2 |
| 2010 | 30,244.4 | 32,810.6 | 33,731.9 | 33,605.3 | 34,254.1 | 33,843.0 | 33,608.6 | 33,844.8 | 33,414.7 | 33,304.1 | 32,725.4 | 32,802.1 |
| 2011 | 31,863.1 | 33,178.7 | 33,205.6 | 33,234.2 | 33,340.3 | 33,692.1 | 32,954.2 | 34,029.1 | 33,942.3 | 33,313.6 | 32,614.2 | 33,099.8 |
| 2012 | 30,198.7 | 31,992.0 | 31,639.8 | 31,451.5 | 32,260.7 | 32,444.0 | 31,521.5 | 32,872.6 | 31,924.9 | 31,648.1 | 30,534.0 | 30,468.8 |
| 2013 | 30,245.2 | 30,982.7 | 31,708.7 | 31,603.3 | 31,729.1 | 33,446.5 | 32,391.5 | 33,226.9 | 30,360.4 | 30,337.1 | 29,220.8 | 29,415.4 |
| 2014 | 28,335.8 | 29,415.8 | 30,068.6 | 30,185.7 | 30,382.1 | 30,043.9 | 30,251.4 | 30,278.5 | 29,751.4 | 29,797.3 | 29,272.5 | 29,526.9 |
| 2015 | 28,666.5 | 29,990.0 | 30,901.8 | 30,535.4 | 30,579.3 | 31,254.1 | 30,341.5 | 31,895.6 | 31,285.5 | 30,884.3 | 29,710.8 | 29,659.9 |
| 2016 | 28,551.4 | 30,216.3 | 30,465.1 | 30,743.9 | 30,270.2 | 31,315.3 | 31,263.0 | 31,605.2 | 30,752.0 | 30,791.0 | 30,203.5 | 29,712.9 |
| 2017 | 28,342.0 | 29,452.1 | 30,848.8 | 30,550.7 | 30,998.3 | 31,437.3 | 30,639.9 | 31,516.3 | 30,715.1 | 30,664.3 | 29,526.5 | 29,695.6 |
| 2018 | 28,222.1 | 30,060.6 | 30,195.3 | 30,670.5 | 30,889.0 | 31,162.1 | 30,646.8 | 31,509.2 | 30,480.0 | 30,461.4 | 29,518.9 | 29,356.6 |
| 2019 | 28,266.2 | 29,195.2 | 28,624.1 | 30,259.8 | 30,043.5 | 30,477.0 | 29,714.1 | 30,965.4 | 29,523.5 | 29,899.1 | 28,783.3 | 28,398.1 |
| 2020 | 27,913.4 | 28,914.1 | 23,009.3 | 17,128.7 | 20,566.5 | 23,769.4 | 24,089.9 | 24,690.0 | 24,129.4 | 24,446.7 | 23,363.8 | 22,111.6 |
| 2021 | 21,201.5 | 22,887.0 | 24,433.1 | 25,828.4 | 25,779.0 | 26,339.0 | 26,198.7 | 25,986.6 | 25,825.8 | 25,013.2 | 24,874.5 | 24,659.6 |
| 2022 | 22,395.8 | 24,862.0 | 25,221.8 | |||||||||
| - = No Data Reported; -- = Not Applicable; NA = Not Available; W = Withheld to avoid disclosure of individual company data. |
| Release Date: 5/19/2022 |
| Next Release Date: TBD |