|
Download Data (XLS File) |
|
||||||||
|
||||||||
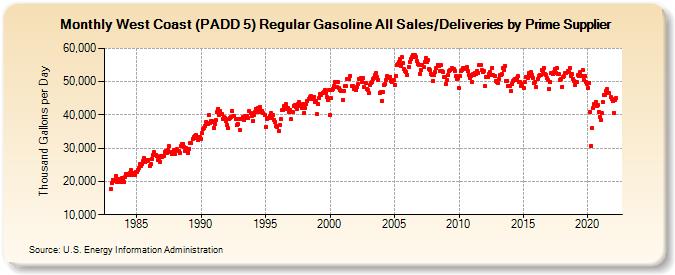
| West Coast (PADD 5) Regular Gasoline All Sales/Deliveries by Prime Supplier (Thousand Gallons per Day) | ||||||||
| Year | Jan | Feb | Mar | Apr | May | Jun | Jul | Aug | Sep | Oct | Nov | Dec |
|---|---|---|---|---|---|---|---|---|---|---|---|---|
| 1983 | 17,795.5 | 19,446.8 | 20,528.8 | 20,528.9 | 20,173.3 | 21,669.5 | 19,749.6 | 20,756.5 | 20,483.9 | 19,765.8 | 20,976.2 | 20,629.6 |
| 1984 | 19,798.6 | 21,299.8 | 22,384.5 | 22,217.9 | 22,006.7 | 21,905.6 | 22,464.5 | 23,367.1 | 21,952.4 | 22,426.8 | 21,843.1 | 22,817.2 |
| 1985 | 22,842.0 | 23,563.6 | 24,180.1 | 25,280.1 | 24,591.1 | 25,253.2 | 26,191.0 | 27,037.0 | 25,737.6 | 26,453.8 | 26,295.7 | 26,509.9 |
| 1986 | 24,546.1 | 25,258.6 | 26,883.2 | 27,865.2 | 28,761.8 | 27,935.6 | 28,020.0 | 27,597.1 | 26,323.2 | 27,159.3 | 25,847.4 | 27,511.1 |
| 1987 | 27,276.5 | 27,606.9 | 28,877.5 | 29,293.3 | 28,419.1 | 29,581.7 | 30,529.1 | 28,803.7 | 28,727.8 | 28,310.2 | 28,329.6 | 29,589.8 |
| 1988 | 28,331.4 | 29,338.1 | 29,612.8 | 29,113.8 | 28,651.0 | 30,566.3 | 31,172.5 | 31,389.1 | 30,216.0 | 29,222.0 | 30,173.3 | 29,779.7 |
| 1989 | 28,697.3 | 29,842.2 | 31,415.5 | 31,497.0 | 32,784.7 | 33,272.2 | 33,710.5 | 34,033.7 | 33,060.6 | 32,381.8 | 33,298.1 | 33,271.3 |
| 1990 | 32,678.5 | 34,582.4 | 35,635.1 | 36,148.4 | 36,796.7 | 37,984.8 | 37,381.9 | 39,923.5 | 37,585.4 | 38,206.5 | 38,037.7 | 37,846.8 |
| 1991 | 36,164.6 | 37,296.4 | 38,409.8 | 40,846.0 | 41,862.7 | 40,087.9 | 41,114.2 | 40,218.9 | 38,694.2 | 39,474.2 | 39,099.5 | 38,239.5 |
| 1992 | 36,870.8 | 35,986.0 | 38,764.6 | 38,962.4 | 39,463.4 | 41,141.2 | 39,825.4 | 39,707.1 | 38,917.0 | 36,940.0 | 37,314.3 | 38,633.4 |
| 1993 | 35,480.1 | 38,708.5 | 38,907.7 | 39,377.1 | 38,604.7 | 39,591.9 | 39,439.9 | 39,730.9 | 38,974.0 | 41,069.9 | 40,701.2 | 39,749.5 |
| 1994 | 38,132.3 | 39,901.1 | 40,830.8 | 41,865.4 | 41,435.7 | 42,182.8 | 40,891.5 | 42,410.7 | 41,079.3 | 41,199.2 | 40,480.2 | 40,027.6 |
| 1995 | 36,396.7 | 38,782.6 | 38,937.8 | 38,977.9 | 39,605.6 | 40,489.3 | 39,157.6 | 39,981.5 | 38,616.2 | 37,919.5 | 36,773.2 | 36,297.0 |
| 1996 | 35,198.2 | 37,045.4 | 38,676.4 | 41,354.9 | 41,621.5 | 42,634.5 | 42,387.4 | 43,278.5 | 41,881.8 | 42,224.3 | 40,982.1 | 41,553.2 |
| 1997 | 38,635.1 | 40,842.3 | 42,633.4 | 42,928.4 | 42,472.0 | 41,831.4 | 43,214.3 | 43,925.7 | 42,541.2 | 42,815.8 | 41,991.1 | 43,180.8 |
| 1998 | 40,652.5 | 41,960.4 | 43,342.5 | 44,273.0 | 44,711.3 | 45,410.2 | 45,617.4 | 45,369.9 | 44,737.5 | 45,510.6 | 43,772.9 | 44,287.9 |
| 1999 | 40,141.5 | 43,183.6 | 45,129.6 | 46,432.5 | 46,082.5 | 46,662.7 | 46,926.5 | 47,463.3 | 46,471.1 | 45,323.3 | 44,463.2 | 47,539.8 |
| 2000 | 39,904.2 | 44,974.1 | 47,461.3 | 47,900.3 | 48,738.6 | 49,925.6 | 48,318.6 | 49,788.9 | 48,180.7 | 47,431.5 | 47,197.1 | 47,280.1 |
| 2001 | 44,589.5 | 47,228.0 | 48,740.3 | 48,567.4 | 50,791.3 | 50,912.9 | 50,904.8 | 51,771.4 | 48,550.3 | 48,550.2 | 47,784.3 | 47,685.8 |
| 2002 | 47,464.0 | 48,349.6 | 49,230.7 | 50,833.7 | 50,692.5 | 51,208.6 | 49,899.7 | 51,003.5 | 48,298.9 | 49,733.3 | 47,905.4 | 47,449.1 |
| 2003 | 46,613.0 | 48,996.0 | 49,720.5 | 49,972.9 | 50,818.2 | 51,246.7 | 51,910.5 | 52,660.9 | 51,311.0 | 50,531.3 | 46,679.4 | 46,795.9 |
| 2004 | 44,296.0 | 46,905.4 | 49,013.7 | 49,325.6 | 50,534.9 | 51,663.1 | 51,464.6 | 51,038.9 | 51,531.5 | 50,077.9 | 49,988.2 | 50,627.1 |
| 2005 | 48,959.7 | 51,706.9 | 55,039.6 | 55,305.0 | 55,804.7 | 56,707.1 | 54,735.1 | 57,320.4 | 55,536.0 | 53,678.5 | 53,118.6 | 52,843.9 |
| 2006 | 51,964.4 | 54,439.5 | 55,927.0 | 56,715.7 | 57,468.9 | 57,979.5 | 57,367.1 | 57,881.1 | 57,401.6 | 56,059.0 | 55,415.0 | 55,125.9 |
| 2007 | 52,420.4 | 53,524.7 | 55,123.8 | 54,473.0 | 55,861.7 | 57,122.0 | 55,789.8 | 56,650.7 | 53,952.4 | 53,419.9 | 52,351.1 | 52,005.6 |
| 2008 | 50,219.1 | 51,942.7 | 53,034.5 | 54,166.9 | 55,089.7 | 54,776.1 | 53,145.5 | 54,906.3 | 53,070.3 | 52,922.5 | 51,517.4 | 51,451.0 |
| 2009 | 49,281.1 | 50,454.2 | 51,896.8 | 53,068.7 | 53,478.1 | 54,095.1 | 53,700.6 | 53,912.8 | 53,345.3 | 51,815.6 | 50,697.2 | 51,167.2 |
| 2010 | 48,152.9 | 51,706.7 | 53,271.1 | 53,460.0 | 54,009.8 | 53,864.7 | 53,976.0 | 54,257.5 | 53,197.1 | 52,119.6 | 51,076.8 | 51,589.8 |
| 2011 | 49,915.2 | 52,195.9 | 52,072.6 | 52,531.7 | 52,361.9 | 53,323.5 | 52,744.2 | 55,006.2 | 54,893.2 | 53,575.4 | 52,758.8 | 53,320.6 |
| 2012 | 48,583.5 | 51,463.4 | 51,372.4 | 51,305.4 | 52,415.5 | 52,946.5 | 51,881.3 | 54,202.8 | 51,885.5 | 51,611.7 | 50,170.3 | 49,815.0 |
| 2013 | 49,676.5 | 50,747.0 | 51,861.6 | 51,856.3 | 52,297.1 | 54,242.4 | 53,559.0 | 54,825.4 | 50,189.1 | 50,330.6 | 48,730.0 | 48,825.7 |
| 2014 | 47,135.9 | 49,289.5 | 50,182.4 | 50,442.1 | 50,818.6 | 50,555.2 | 51,043.2 | 51,561.6 | 49,835.6 | 49,942.9 | 48,660.2 | 49,235.8 |
| 2015 | 48,016.0 | 49,982.3 | 51,383.0 | 51,342.0 | 50,987.5 | 52,483.0 | 51,691.6 | 52,941.2 | 51,916.4 | 51,177.5 | 49,503.0 | 49,865.6 |
| 2016 | 48,249.1 | 50,867.4 | 51,735.0 | 52,109.2 | 51,947.5 | 53,479.3 | 53,253.9 | 54,206.7 | 52,305.0 | 52,014.7 | 51,144.2 | 50,530.5 |
| 2017 | 47,887.2 | 49,899.0 | 52,474.3 | 52,244.4 | 52,791.8 | 53,769.9 | 52,744.0 | 54,130.5 | 52,291.2 | 52,177.2 | 50,638.6 | 50,718.4 |
| 2018 | 48,456.4 | 51,298.0 | 51,758.8 | 52,595.3 | 52,650.1 | 53,222.3 | 52,833.8 | 54,002.5 | 51,728.1 | 52,238.0 | 50,917.2 | 50,255.3 |
| 2019 | 49,040.5 | 49,766.4 | 49,811.3 | 52,008.6 | 51,818.9 | 52,930.6 | 51,768.6 | 53,447.1 | 50,573.1 | 51,678.1 | 49,872.4 | 49,306.6 |
| 2020 | 48,197.9 | 49,695.8 | 40,942.5 | 30,766.0 | 36,186.0 | 41,984.7 | 43,152.1 | 43,916.6 | 42,621.2 | 43,032.8 | 40,998.1 | 39,495.3 |
| 2021 | 38,580.7 | 40,441.1 | 43,767.5 | 46,126.4 | 45,935.4 | 47,214.4 | 47,651.1 | 46,573.3 | 46,457.2 | 45,284.8 | 44,849.9 | 44,206.7 |
| 2022 | 40,683.5 | 44,613.7 | 45,026.6 | |||||||||
| - = No Data Reported; -- = Not Applicable; NA = Not Available; W = Withheld to avoid disclosure of individual company data. |
| Release Date: 5/19/2022 |
| Next Release Date: TBD |