|
Download Data (XLS File) |
|
||||||||
|
||||||||
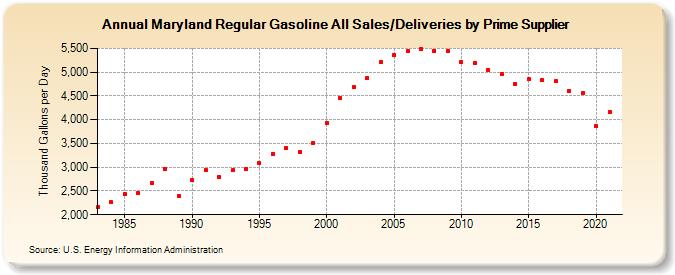
| Maryland Regular Gasoline All Sales/Deliveries by Prime Supplier (Thousand Gallons per Day) | ||||||||
| Decade | Year-0 | Year-1 | Year-2 | Year-3 | Year-4 | Year-5 | Year-6 | Year-7 | Year-8 | Year-9 |
|---|---|---|---|---|---|---|---|---|---|---|
| 1980's | 2,166.1 | 2,260.2 | 2,444.1 | 2,462.0 | 2,666.5 | 2,960.2 | 2,400.1 | |||
| 1990's | 2,724.4 | 2,938.1 | 2,799.4 | 2,931.6 | 2,953.6 | 3,083.6 | 3,285.1 | 3,402.2 | 3,329.3 | 3,511.3 |
| 2000's | 3,931.6 | 4,451.7 | 4,685.3 | 4,876.1 | 5,205.5 | 5,358.9 | 5,442.2 | 5,490.9 | 5,451.1 | 5,441.4 |
| 2010's | 5,205.4 | 5,193.0 | 5,042.8 | 4,963.1 | 4,760.4 | 4,846.5 | 4,827.1 | 4,807.9 | 4,609.5 | 4,559.6 |
| 2020's | 3,863.4 |
| - = No Data Reported; -- = Not Applicable; NA = Not Available; W = Withheld to avoid disclosure of individual company data. |
| Release Date: 6/1/2022 |
| Next Release Date: TBD |