|
Download Data (XLS File) |
|
||||||||
|
||||||||
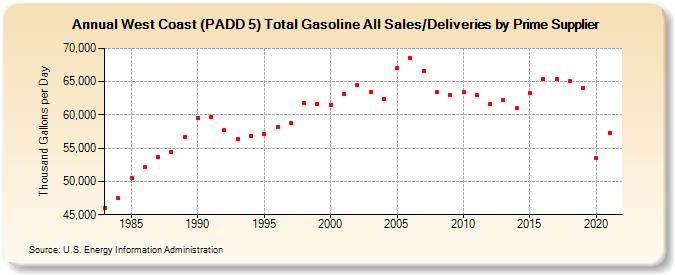
| West Coast (PADD 5) Total Gasoline All Sales/Deliveries by Prime Supplier (Thousand Gallons per Day) | ||||||||
| Decade | Year-0 | Year-1 | Year-2 | Year-3 | Year-4 | Year-5 | Year-6 | Year-7 | Year-8 | Year-9 |
|---|---|---|---|---|---|---|---|---|---|---|
| 1980's | 45,995.3 | 47,439.0 | 50,536.3 | 52,223.5 | 53,724.8 | 54,457.4 | 56,710.8 | |||
| 1990's | 59,597.5 | 59,745.0 | 57,705.4 | 56,435.7 | 56,815.0 | 57,068.9 | 58,167.0 | 58,761.9 | 61,796.3 | 61,676.1 |
| 2000's | 61,550.6 | 63,110.9 | 64,548.8 | 63,419.8 | 62,339.3 | 67,015.3 | 68,560.9 | 66,532.3 | 63,493.0 | 63,058.7 |
| 2010's | 63,374.7 | 62,978.3 | 61,589.2 | 62,188.9 | 61,007.5 | 63,342.2 | 65,411.9 | 65,409.3 | 65,029.7 | 64,031.8 |
| 2020's | 53,485.8 |
| - = No Data Reported; -- = Not Applicable; NA = Not Available; W = Withheld to avoid disclosure of individual company data. |
| Release Date: 6/1/2022 |
| Next Release Date: TBD |