|
Download Data (XLS File) |
|
||||||||
|
||||||||
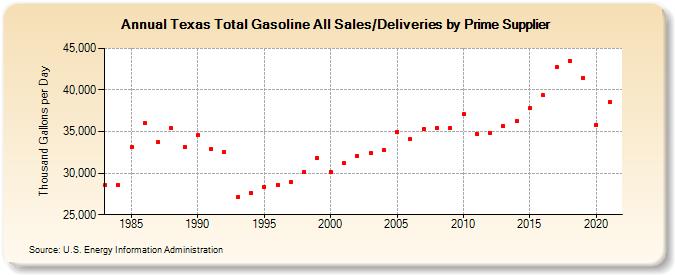
| Texas Total Gasoline All Sales/Deliveries by Prime Supplier (Thousand Gallons per Day) | ||||||||
| Decade | Year-0 | Year-1 | Year-2 | Year-3 | Year-4 | Year-5 | Year-6 | Year-7 | Year-8 | Year-9 |
|---|---|---|---|---|---|---|---|---|---|---|
| 1980's | 28,565.3 | 28,554.0 | 33,100.6 | 35,977.3 | 33,728.8 | 35,394.9 | 33,163.7 | |||
| 1990's | 34,532.2 | 32,885.4 | 32,536.2 | 27,110.8 | 27,652.6 | 28,358.5 | 28,623.0 | 28,878.9 | 30,168.4 | 31,860.9 |
| 2000's | 30,159.7 | 31,175.0 | 32,074.3 | 32,368.9 | 32,735.2 | 34,966.3 | 34,054.8 | 35,275.5 | 35,479.4 | 35,428.0 |
| 2010's | 37,093.8 | 34,694.1 | 34,874.0 | 35,660.0 | 36,263.7 | 37,794.0 | 39,346.5 | 42,776.6 | 43,505.5 | 41,499.0 |
| 2020's | 35,824.9 |
| - = No Data Reported; -- = Not Applicable; NA = Not Available; W = Withheld to avoid disclosure of individual company data. |
| Release Date: 6/1/2022 |
| Next Release Date: TBD |