|
Download Data (XLS File) |
|
||||||||
|
||||||||
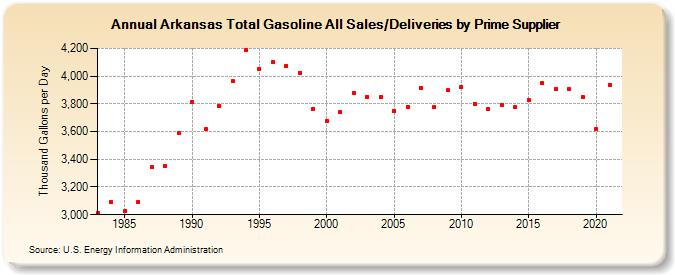
| Arkansas Total Gasoline All Sales/Deliveries by Prime Supplier (Thousand Gallons per Day) | ||||||||
| Decade | Year-0 | Year-1 | Year-2 | Year-3 | Year-4 | Year-5 | Year-6 | Year-7 | Year-8 | Year-9 |
|---|---|---|---|---|---|---|---|---|---|---|
| 1980's | 3,013.9 | 3,092.8 | 3,024.8 | 3,091.9 | 3,342.4 | 3,348.7 | 3,588.0 | |||
| 1990's | 3,814.5 | 3,615.5 | 3,783.1 | 3,964.7 | 4,185.6 | 4,054.2 | 4,099.9 | 4,075.7 | 4,024.3 | 3,764.4 |
| 2000's | 3,675.0 | 3,740.2 | 3,879.8 | 3,852.3 | 3,850.9 | 3,748.6 | 3,777.9 | 3,916.0 | 3,775.6 | 3,898.6 |
| 2010's | 3,920.2 | 3,799.4 | 3,761.3 | 3,792.3 | 3,776.4 | 3,829.5 | 3,949.7 | 3,907.8 | 3,905.1 | 3,850.3 |
| 2020's | 3,618.3 |
| - = No Data Reported; -- = Not Applicable; NA = Not Available; W = Withheld to avoid disclosure of individual company data. |
| Release Date: 6/1/2022 |
| Next Release Date: TBD |