|
Download Data (XLS File) |
|
||||||||
|
||||||||
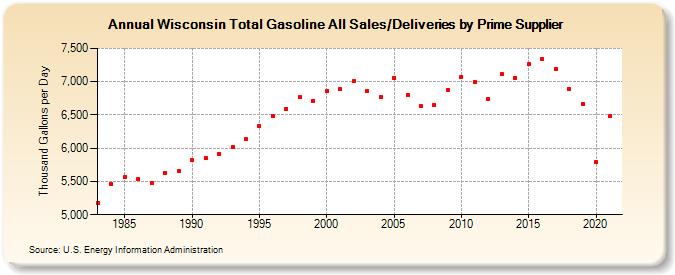
| Wisconsin Total Gasoline All Sales/Deliveries by Prime Supplier (Thousand Gallons per Day) | ||||||||
| Decade | Year-0 | Year-1 | Year-2 | Year-3 | Year-4 | Year-5 | Year-6 | Year-7 | Year-8 | Year-9 |
|---|---|---|---|---|---|---|---|---|---|---|
| 1980's | 5,174.9 | 5,460.2 | 5,559.9 | 5,534.6 | 5,472.2 | 5,631.3 | 5,661.6 | |||
| 1990's | 5,816.9 | 5,850.4 | 5,917.1 | 6,012.0 | 6,135.2 | 6,329.4 | 6,478.1 | 6,596.4 | 6,768.0 | 6,713.5 |
| 2000's | 6,855.2 | 6,884.1 | 7,010.1 | 6,858.9 | 6,770.1 | 7,059.5 | 6,802.8 | 6,629.6 | 6,651.7 | 6,879.8 |
| 2010's | 7,076.8 | 6,992.7 | 6,744.4 | 7,110.2 | 7,051.7 | 7,264.6 | 7,346.6 | 7,188.0 | 6,895.3 | 6,668.3 |
| 2020's | 5,794.5 |
| - = No Data Reported; -- = Not Applicable; NA = Not Available; W = Withheld to avoid disclosure of individual company data. |
| Release Date: 6/1/2022 |
| Next Release Date: TBD |