|
Download Data (XLS File) |
|
||||||||
|
||||||||
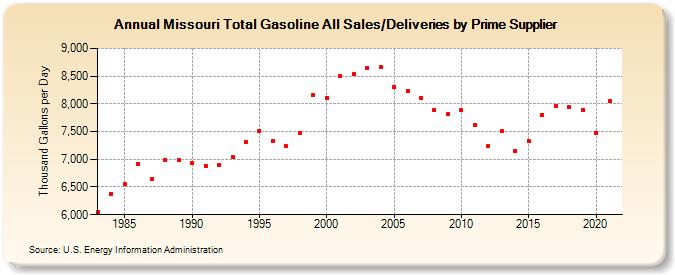
| Missouri Total Gasoline All Sales/Deliveries by Prime Supplier (Thousand Gallons per Day) | ||||||||
| Decade | Year-0 | Year-1 | Year-2 | Year-3 | Year-4 | Year-5 | Year-6 | Year-7 | Year-8 | Year-9 |
|---|---|---|---|---|---|---|---|---|---|---|
| 1980's | 6,052.3 | 6,375.7 | 6,548.6 | 6,910.3 | 6,637.6 | 6,985.3 | 6,990.5 | |||
| 1990's | 6,928.5 | 6,885.7 | 6,898.7 | 7,042.2 | 7,318.2 | 7,512.2 | 7,335.2 | 7,234.6 | 7,473.3 | 8,154.1 |
| 2000's | 8,112.5 | 8,493.1 | 8,543.0 | 8,655.0 | 8,655.5 | 8,310.9 | 8,227.6 | 8,105.0 | 7,895.2 | 7,808.0 |
| 2010's | 7,883.5 | 7,623.3 | 7,243.1 | 7,513.6 | 7,153.4 | 7,336.1 | 7,804.0 | 7,962.6 | 7,939.4 | 7,894.9 |
| 2020's | 7,469.3 |
| - = No Data Reported; -- = Not Applicable; NA = Not Available; W = Withheld to avoid disclosure of individual company data. |
| Release Date: 6/1/2022 |
| Next Release Date: TBD |