|
Download Data (XLS File) |
|
||||||||
|
||||||||
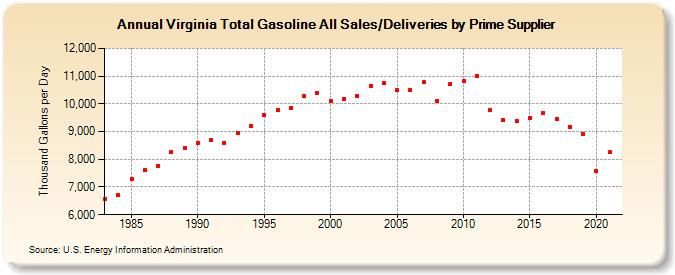
| Virginia Total Gasoline All Sales/Deliveries by Prime Supplier (Thousand Gallons per Day) | ||||||||
| Decade | Year-0 | Year-1 | Year-2 | Year-3 | Year-4 | Year-5 | Year-6 | Year-7 | Year-8 | Year-9 |
|---|---|---|---|---|---|---|---|---|---|---|
| 1980's | 6,563.6 | 6,705.6 | 7,282.8 | 7,599.8 | 7,766.9 | 8,261.3 | 8,403.9 | |||
| 1990's | 8,605.0 | 8,683.5 | 8,597.5 | 8,950.9 | 9,199.2 | 9,588.0 | 9,771.3 | 9,865.0 | 10,271.3 | 10,375.3 |
| 2000's | 10,092.5 | 10,189.0 | 10,270.3 | 10,637.8 | 10,739.1 | 10,488.6 | 10,489.3 | 10,796.4 | 10,086.6 | 10,713.2 |
| 2010's | 10,807.2 | 11,018.7 | 9,760.7 | 9,407.4 | 9,376.0 | 9,502.8 | 9,674.7 | 9,444.5 | 9,168.0 | 8,909.1 |
| 2020's | 7,559.0 |
| - = No Data Reported; -- = Not Applicable; NA = Not Available; W = Withheld to avoid disclosure of individual company data. |
| Release Date: 6/1/2022 |
| Next Release Date: TBD |